Categories
Uncategorized

Mobile Development News Roundup for Tuesday, May 22, 2012

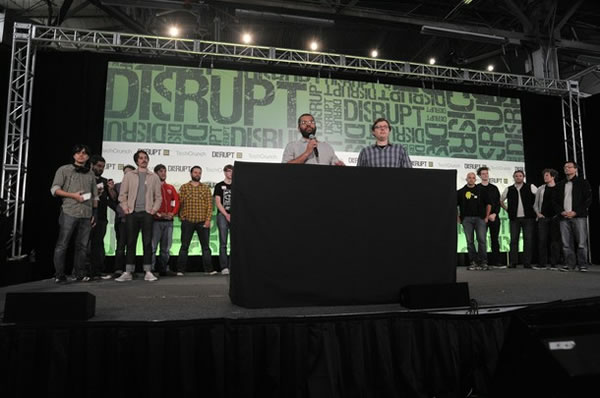
Apple rules the mobile roost at TechCrunch Disrupt NY. “Pretty much every product being showcased was either built for iOS, or had been launched on Apple’s App store after appearing on another operating system,” says this Forbes article, which also points out that the prevalent phones, tablets and computers were iPhones, iPads and and MacBooks.

If you’re thinking of trying out RubyMotion, the toolchain that lets you write iOS apps in Ruby, you’ll want to check out a couple of articles by Tim Bugai over at Collective Idea’s blog:

  • 5 Awesome Things About RubyMotion: A quick list of some of the benefits that Tim’s enjoying by developing iOS apps with RubyMotion instead of XCode and Objective-C.
  • Using RubyMotion with Parse.com: If your mobile app needs a back end, Parse.com is a quick and easy way to get one up and running in a hurry. This article features an example where you build a mobile chatroom app using RubyMotion and a back end providing push notifications with Parse.com.

Four Types of Mobile Apps. Chris Dixon says that if you’re trying to create or invest in a mobile app, it’s helpful to think of the four categories that apps typically fall into:

  1. Time wasters: Apps used in short bursts, typically to make the time pass a little more quickly while you’re waiting or in transit.
  2. Core utilities: The must-have apps that you use all the time, such as phone, contacts, texting, calendar and so on.
  3. Episodic utilities: The apps that you don’t use all the time, but are incredibly handy during those times when you need them. Examples include Hipmunk when you’re trying to book a flight or OpenTable when you’re making restaurant reservations.
  4. Notification-driven apps: Apps that notify you when certain events occur. Chris says that this is an emerging category of apps that he expects to grow as apps get smarter about when to notify and as battery life gets better.

Selecting a Mobile Implementation Strategy: This article presents two strategies for building mobile apps:

  1. The “Laser” Strategy, in which you focus on a small set of features on a single platform and make the user experience highly polished and immersive.
  2. The “Cover Your Bases” Strategy, in which you build a lower-fidelity app, but one that works across many mobile platforms.
Categories
Uncategorized

NetMarketShare Says IE Still Has a Comfy Lead

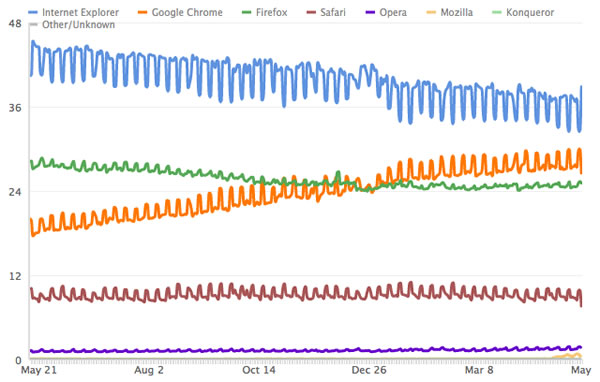
I’ve written about StatCounter’s data that suggests that Chrome is now the number one browser in terms of share. I’ve also written about data from W3Counter and Clicky indicating that Chrome isn’t the number one browser yet, but should be in a matter of weeks or months at most.

What I haven’t written about until now is the site tracking web browser share whose data doesn’t agree with StatCounter, W3Counter and Clicky: Net Applications’ NetMarketShare. Here’s their desktop browser share trends graph, which says that IE’s market share is greater than 50% and, believe it or not, climbing slightly:

Click the graph to see the live version on NetMarketShare’s site.

According to an article in the IE Blog published in March (in response to reports of Chrome’s gaining on IE), NetMarketShare’s methods of measuring browser share differs from StatCounter’s, and presumably W3Counter’s and Clicky’s. Their methods, which involve not counting Chrome’s pre-rendered pages and using geoweighting, put IE at the top of the heap by a great margin, so naturally their stats are the ones that Microsoft highlights.

In case you saw the “.aspx” extension of NetMarketShare’s site and automatically wrote them off as practitioners of what I like to call “Microsophistry”, keep in mind that their stats paint a pretty sad picture for Microsoft’s mobile browser share. There, mobile IE is too small a player to be named:

Click the graph to see the live version on NetMarketShare’s site.

Categories
Uncategorized

W3Counter and Clicky Say That Chrome Isn’t the Number One Browser…Yet!

Yesterday’s article, Chrome is Now the Most-Used Browser, pointed out that according to StatCounter’s data, Chrome has edged out Internet Explorer as the most-used browser.  StatCounter gets these numbers from the sites that use their analytics widget (these sites include this blog, Global Nerdy and my personal blog, The Adventures of Accordion Guy in the 21st Century), so while they provide an accurate picture of browser share for visitors to StatCounter-equipped sites, they might provide a skewed picture of browser share for the internet in general.

I decided to look at other sources that also track browser share and compare the trends they observe to StatCounter’s. Similar trends would be evidence that StatCounter’s numbers were a reasonable measure of browser share, while different trends would suggest that StatCounter’s numbers might need to be taken with a larger grain of salt.

Unfortunately, there aren’t many sites that publish browser share data. Aside from StatCounter, the only two other such sites that I’m aware of are W3Counter and Clicky.

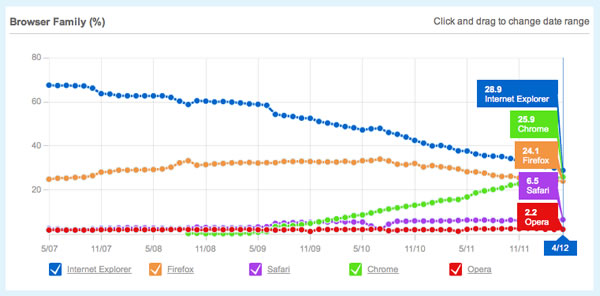
Here’s W3Counter’s graph showing browser share over the past five years:

Click the graph to see the live version on W3Counter’s site.

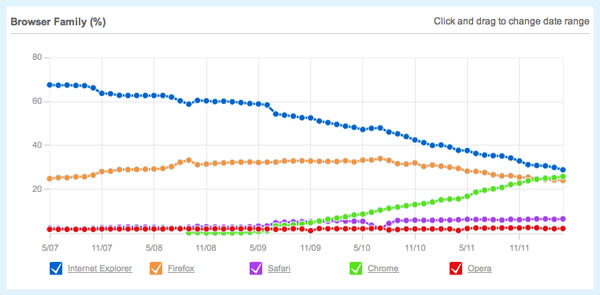
Note the usage share trends for Internet Explorer (the blue line) and Chrome (the green line). Their slopes are pretty similar to the IE/Chrome lines in StatCounter’s graphs. The latest data on the graph is for April 2012, and if the trend continued, W3Counter just might report that Chrome has surpassed Internet Explorer when they publish their May statistics.

W3Counter’s graph has a feature that lets you see browser share at any given time by hovering the cursor over it at the time of your choosing. For April 2012, they report that IE has 28.9% of the market share, while Chrome is a mere three percent away at 25.9%:

Click the graph to see the live version on W3Counter’s site.

Clicky’s trends also show a declining IE share and a climbing Chrome share. The difference is that they’re reporting a larger lead for Internet Explorer:

Click the graph to see the live version on Clicky’s site.

If these trends continue, Clicky should be reporting Chrome as the top browser in a few months.

Categories
Uncategorized

The Browser Share Situation, in Cartoon Form

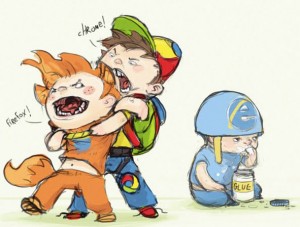
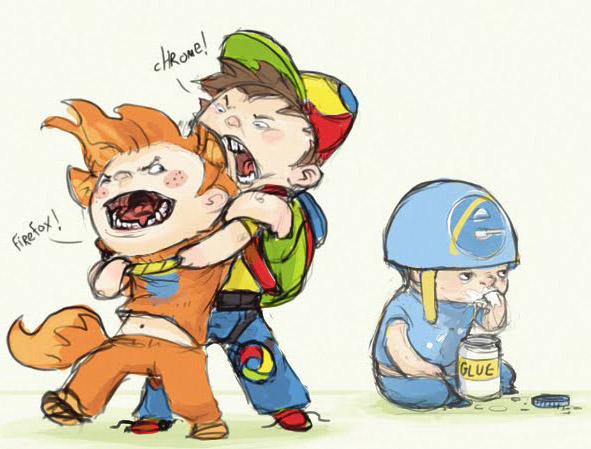
In case you hadn’t heard, Statcounter’s current live browser stats say that Chrome has just edged out Internet Explorer as the most-used browser. That news led me to search my backup drive for an image I’ve been saving in case this very situation arose:

Categories
Uncategorized

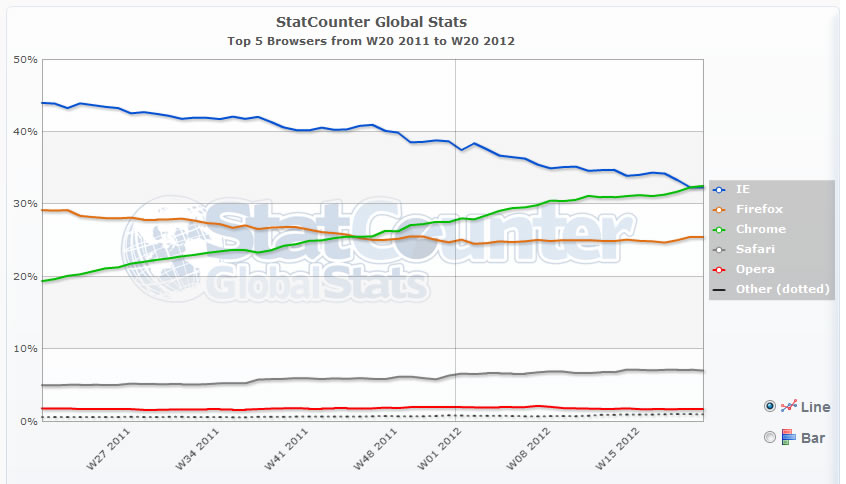
Chrome is Now the Most-Used Browser

Click the graph to see the live result.

According to StatCounter, the web analytics service used by both this blog and the Accordion Guy blog, Chrome has just edged past Internet Explorer in usage share. This is quite a change from a year ago, when Internet Explorer still held first place at about 45% and Chrome was a distant third with about 20% by StatCounter’s measurements.

What will the graph look like a year from now?

Update: I’ve posted an article showing browser usage share stats by W3Counter and Clicky. I’ve also written an article about NetMarketShare’s stats, which say that IE has a very comfortable lead and is even trending slightly upward. You might also find this comic amusing.

Categories
Uncategorized

Mobile Development News Roundup for Friday, May 18, 2012

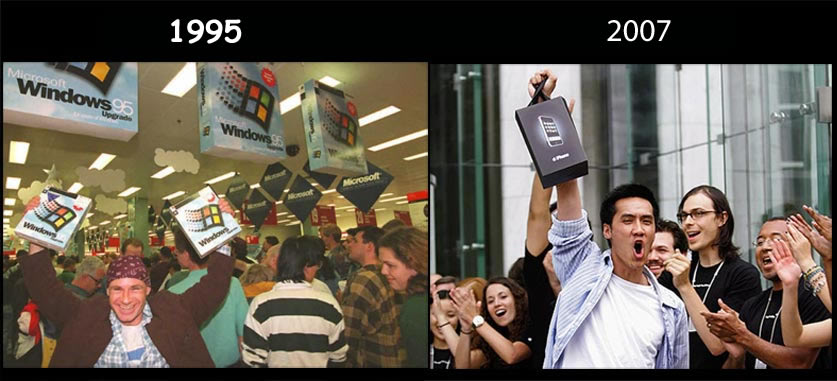
Oh, How Things Have Changed

I stumbled across this graphic, which illustrates the difference between the world of tech when I entered the job market (1995) and five years ago, when it well and truly changed:

Click the image to see it at full size.

WinRT Tablet Makers Can’t Compete with the iPad’s Price

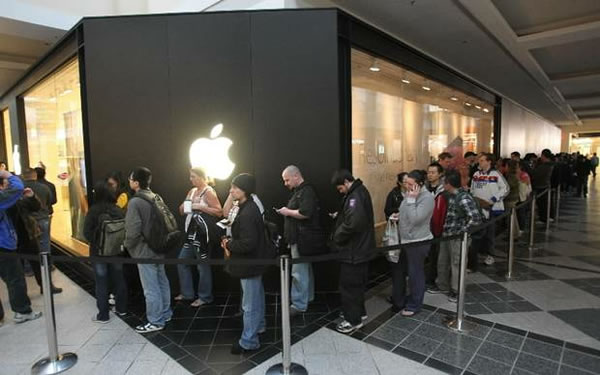
Here’s something you’ll never see when WinRT (the official name for the flavour of Windows 8 that will run on ARM-powered devices) and the tablets it runs on come out:

The line for the New iPad at the Apple Store in Buffalo, March 2012.

ExtremeTech reports that two major factors are making it difficult for Taiwanese manufacturers to make tablets that would sell at prices comparable to or cheaper than Apple’s iPads:

  • The cost of Windows 8 licenses. Digitimes reports that OEMs have to pay as much as $100 for each, but take that with a grain of salt; they’re a notoriously unreliable source of information. ExtremeTech says that Microsoft is likely charging half that amount or less, but even at $10 – $20 per licence, the other factors would still make it difficult to compete on price.
  • The cost of iPad production. Apple have had the time to work out their design and production process as well as their supply chains to the point where it costs less to produce an iPad than any of its less beautifully-designed, lower-spec tablet rivals. ExtremeTech notes that this is equally true for the situation with the MacBook Air and non-Apple “ultrabooks”: you get better design and specs and price with Apple.

Let’s suppose that the WinRT tablet manufacturers decide to sell their wares at a razor-thin margin in order to compete on price. Apple could reduce its 100% markup, beat them at the price game and still make a tidy profit.

Even if the WinRT OEMs decided to use the “compete on price” gambit in the hopes that short-term pain will eventually lead to long-term gain, success will hinge on a variable completely out of their control: that the public will want WinRT at least as much as iOS, if not more. That’s a bit of a longshot.

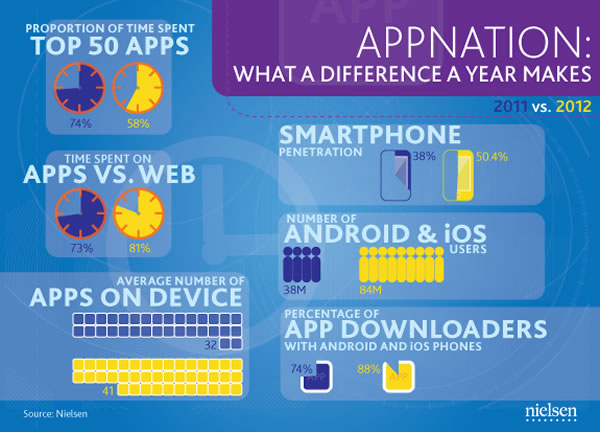
Nielsen’s “State of the Appnation” Report

Some notable stats from their report:

  • One in two US mobile subscribers had a smartphone now. This is up 10% from last year.
  • The number of Android and iOS users combined has more than doubled since 2011, from 38 million to 84 million.
  • Smartphone users today have more apps on their phones than last year. The 2011 average was 32, the 2012 average is 41.
  • Smartphone users are spending more time using apps rather than the mobile web — about 10% more than last year.

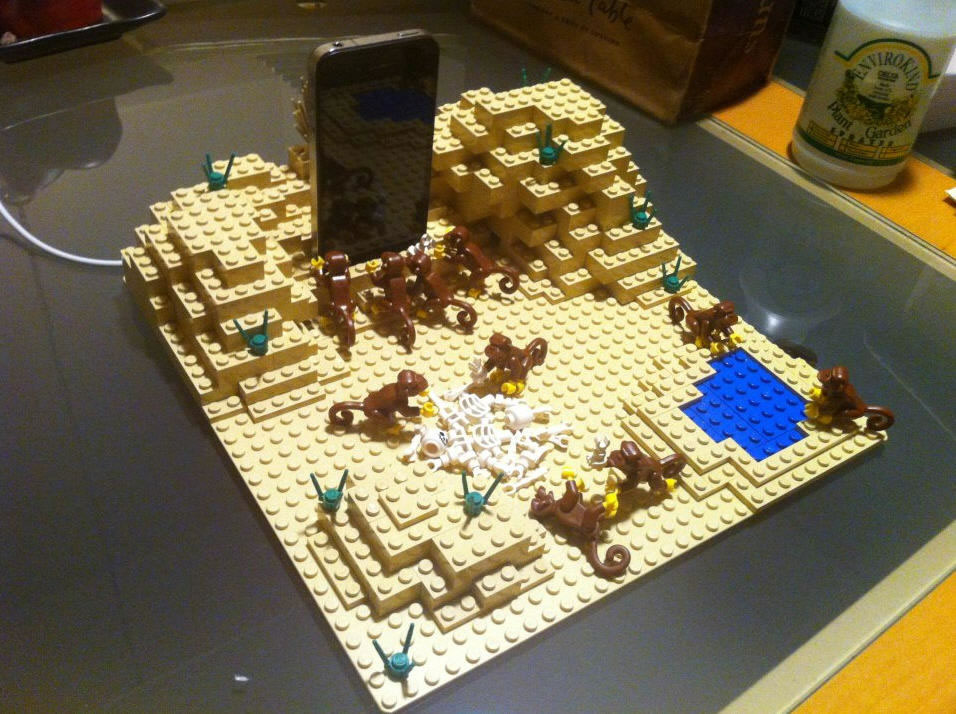
2001: An iPhone Charging Station

Photo courtesy of “spoon”. Click to see the full-size version.

I rather like this iPhone charger made of Lego and inspired by the “Dawn of Man” sequence from 2001: A Space Odyssey:

Categories
Uncategorized

The $100 “Make Like a Sponsor” Conference Swag Trick

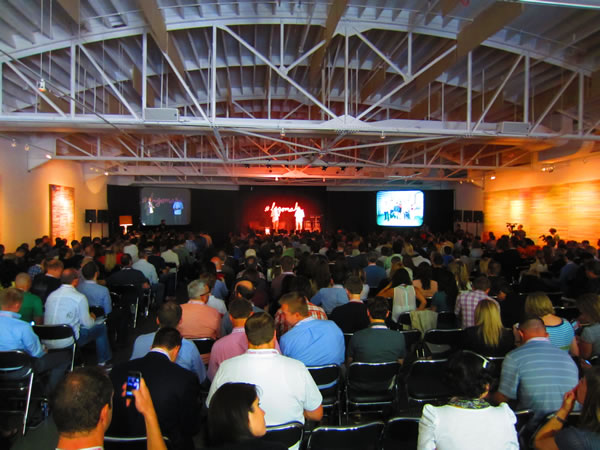
At last week’s Big Omaha conference, I wanted to boost Shopify’s presence there, in spite of the fact that we weren’t sponsors. In exchange for big money, sponsors get to have their logos plastered on all sorts of things, they get name-checked by the MC and theirs are the names that you often remember after the last attendee staggers out of the last after-party.

Not everyone can be a sponsor: in some cases, you don’t have the money or have other, higher-priority things that you want to spend it on, and in other cases, you have the money and want to sponsor, but you’ve missed the deadline and the conference’s sponsor rolls are full. My own case was a little bit of both, and I decided to come up with an inexpensive way to leave a sponsor-like impact at Big Omaha — aside from playing the accordion, of course. Feel free to borrow this trick from me — and let me know how it works!

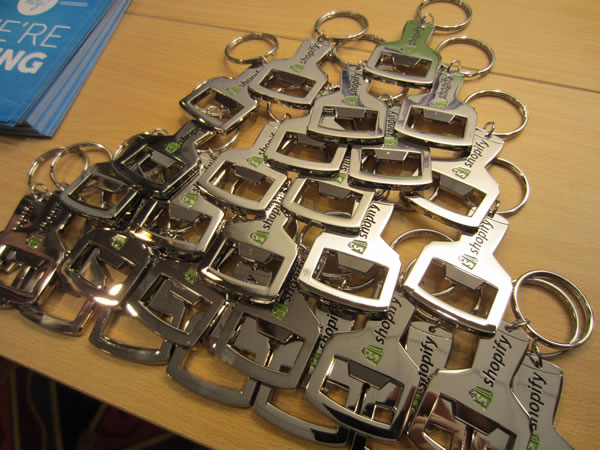
I started with the usual Shopify promotional swag. I keep a stash of Shopify stickers, coasters and bottle openers. These are, for the purposes of this exercise, free.

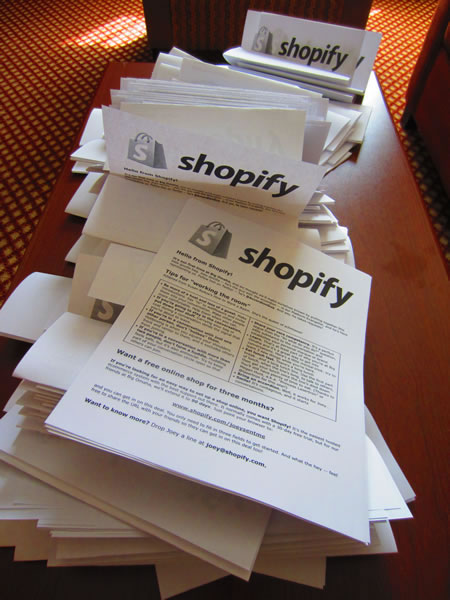
I created a one-page flyer that said “Hello from Shopify!”, introduced me as the Platform Evangelist and announced my presence at the conference. The flyer also provides some useful information for attendees: a quick list of tips on how to “work the room”. Finally, it presented an offer to all attendees and their friends: three months of Shopify free if you sign up for a shop at an URL which I’d had set up earlier.

I printed and made 200 copies of the flyer at the FedEx Office near me. If you’d like a copy of the flyer, click here (it’s a 218KB zipped PDF file)! The cost of printing and copying came out to about $25.

Next purchase: 150 paper lunch sacks. I was staying in downtown Omaha an uncertain how close the nearest grocery store would be, so I picked them up at a grocery store close to home and along with the swag and flyers, packed them with my luggage. The total cost for 150 bags was $7.

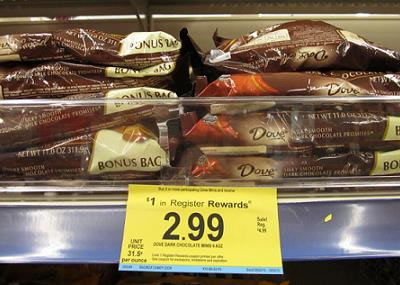
Final purchase: chocolate! I had a word with the people at my hotel’s front desk during the afternoon lull and got them to give me a lift in the courtesy van to the nearest Walgreen’s where I bought $60 worth of Dove chocolates — the little ones wrapped in foil that come in bags. They’re usually available on special, so I was really able to stretch my dollar on this one, and the courtesy van ride — to the drugstore and back (the driver waited while I quickly made my purchase) — was free.

I spent an hour and a quarter assembling the loot bags in my hotel room the day before the conference. I folded the flyers first. Then I popped open the bags and sat them upright in rows, after which I stuffed them with the flyers, swag and about 4- 8 chocolates each.

I attended the evening party, after which I returned to the hotel around midnight and asked the front desk for a ride to the conference venue in the courtesy van  in the morning, as well as whatever large boxes they could spare (to carry the loot bags). They were happy to help out. (The trick is to make your special requests during lulls — they’re not being deluged with calls for help from other guests and are probably bored and looking for something to break up the monotony.)

In the morning, I found that some other guest who hadn’t reserved the van but needed a last-minute ride to the airport or else he’d miss his flight had commandeered it. After explaining that I couldn’t carry several boxes of loot bags to the conference without a vehicle, the general manager decided to give me a ride in his own car.

“It’s a little unusual,” he said. “D’you mind if there’s no doors?”

“Sounds like fun. What kind of car do you have?”

“Wait,” he said, and moments later, appeared in this beast:

So this is how I came to Big Omaha: large, in charge, and bearing 150 loot bags.

I dragged the boxes in and positioned myself in a spot where people were making their way to their seats and handed out the loot bags.

It made an impact on at least one person:

So there you have it: all the reach of a sponsor swag table or big logo on a wall, complete with whatever message you want to send, for about a hundred bucks. As I said earlier, feel free to borrow this little conference trick, and tell me how it works out for you!