Sometimes, when I read stuff on the web, it makes me want to do this.
I’ve seen technology make some great leaps over the past three decades. As for some technologists, they’ve remained stuck in the stone age.
“She’s Only Here Because of Her Tits”
Here’s the start of game developer Andy Moore’s most recent blog post:
Last night was the end of an amazing GDC trip. A handful of remaining friends and I made a journey out to JapanTown and we had an amazing meal. It was a great way to end the trip.
One of my friends, and a fellow game developer, was there for dinner. Her trip to GDC was planned last-minute, thanks to someone obtaining her a (very expensive!) all-access pass.
When recounting this chain of events, a male game developer at the table said that she only got the GDC pass “because of her tits.”
The table largely responded with aghast looks and silence. It was brought up that perhaps her ticket was thanks to being an award-winning game developer.
The same male responded with the ever-classy “sure, award winning tits.”
Ah, the “fake geek girl” accusation, just in slightly different form. As this Atlantic article puts it, it’s not really about female duplicity, but male insecurity.
For even more jack-assery, read the post and check out the comments. Zoe, the female game developer who got the pass and was the target of the dickish remark, tells the story from her perspective, and another game developer named Phil — who at least in the beginning seems to have good intentions — effectively tells her to “man up”.
And we wonder why the industry is such a god-damned sausage party.
Programmers Being Dicks
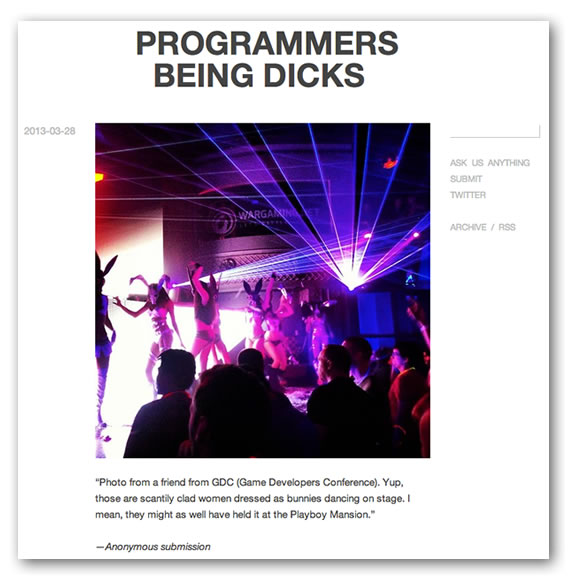
Andy Moore’s story would fit very well in the tumblr of similar stories called Programmers Being Dicks. It’s been around for just over a year, and you get three guesses as to what it’s all about.
Navigating the Sausage Party
Shoreditch Works has a great collection of advice on how to navigate the male-skewed tech industry and tech conferences, and even some good advice for guys from Aanand Prasad, which I’ll repeat below:
No-one is without privilege, but as a man, you’ve been dealt a truckload. It’s difficult to acknowledge it without feeling ashamed or defensive, which is probably where that ridiculous idea of the “man-hating feminist” comes from. Just remember:
1. Your privilege isn’t something to be ashamed of– it’s something to be aware of. Being a man doesn’t make you a bad person – not giving a shit about it makes you a bad person.
2. Your privilege isn’t going to go away just because you’re aware of it: It’s always going to be there, clouding your perceptions and simplifying the world for you. Remain vigilant!
3. There are some things you should simply never do: Never tell a member of an oppressed group they’re not oppressed – you’ll do more harm than good, without fail.
4. Be careful not to hijack discussions: Men are taught to speak with authority even when they have none, even when others are more qualified to speak. Conversely, oppressed groups are taught to doubt their authority. Shut up and listen.
5. If you have any doubt in your mind as to whether to make a joke: don’t. You have nothing to gain. If you genuinely believe you can’t be funny without alienating people, you’re a desperately unimaginative person.
The Distress of the Privileged / “But I Was Okay With It!”

The topic of privilege — especially male privilege — often brings up indignation or eye-rolling from guys who’d otherwise seem to be upstanding people. The problem is that privilege is one of those things that you don’t notice when you’ve got it, even though it seems like it would be obvious if you did (“How can I be privileged? The mayor’s never given me the key to the city!”). Blogger Doug Muder does a great job of summarizing this feeling in The Distress of the Privileged. He uses a scene from the movie Pleasantville to make his point, hence the WIlliam H. Macy screencaps above.

Another worthwhile read is the last item in Cracked’s article, 5 Ways You’re Accidentally Making Everyone Hate You. All five ways, it turns out, end up being variations on the theme of power dynamics between people. The relevant item’s titled “But I Was Okay With It!”, and here are the key excerpts:
This will happen to you. You will be on one side of a conflict that does not feel like a conflict to you, because that is the conflict. Trust me, there’s a great chance you’ll be oblivious to it until it’s too late. Entire governments have fallen this way.
In many cases, they mean it honestly – “I’m not angry at anyone, I just want to leave things the way they are.Which incidentally involves me having all of the power.”
Snow Crash and Sexism in Tech
And finally, here’s the full text of an entry I made earlier in my personal blog, The Adventures of Accordion Guy in the 21st Century…
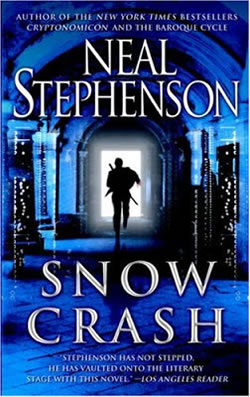
It’s been over twenty years since Neal Stephenson’s “cyberpunk” novel Snow Crash was first published. A young Cory Doctorow, then working at the sci-fi bookstore Bakka Books, saw me in my engineering jacket from Crazy Go Nuts University and convinced me to buy it.
As is the tradition with the best science fiction, Snow Crash is is densely packed with all sorts of interesting ideas about present-day society, somewhat disguised in the wrappings of what was then the near future. Stephenson has a gift for illustrating them, and a number stand out in my mind even years later, such as how children’s pajamas of that near future could either be fireproof or non-carcinogenic (but not both!), or how every guy under 25 secretly believes that under the right circumstances, he could’ve been the biggest badass in the world.
I first read the book in late 1992, soon after it was published. It had been only a couple of years since the killing of fourteen women at Montreal’s École Polytechnique, a couple of months since Anita Hill’s testimony at Clarence Thomas’ confirmation hearings, and Naomi Wolf’s The Beauty Myth and Susan Faludi’s Backlash: The Undeclared War Against American Women were often-discussed topics on my university’s campus. All this, along with my own sense of social justice, is likely why of all the interesting ideas that Stephenson put into Snow Crash, the one that stands out most for me was how men in tech viewed women in tech.
Here’s the excerpt, with some added formatting. Given what’s going on in the world of tech today (including the surprised reactions at the discovery that the person who runs the wildly popular I Fucking Love Science Facebook page is a woman), it’s still spot-on:
Her name is Juanita Marquez.
Hiro has known her ever since they were freshmen together at Berkeley, and they were in the same lab section in a freshman physics class. The first time he saw her, he formed an impression that did not change for many years: She was a dour, bookish, geeky type who dressed like she was interviewing for a job as an accountant at a funeral parlor. At the same time, she had a flamethrower tongue that she would turn on people at the oddest times, usually in some grandiose, earth-scorching retaliation for a slight or breach of etiquette that none of the other freshmen had even perceived.
It wasn’t until a number of years later, when they both wound up working at Black Sun Systems, Inc., that he put the other half of the equation together. At the time, both of them were working on avatars. He was working on bodies, she was working on faces.
She was the face department, because nobody thought that faces were all that important — they were just flesh-toned busts on top of the avatars. She was just in the process of proving them all desperately wrong. But at this phase, the all-male society of bit-heads that made up the power structure of Black Sun Systems said that the face problem was trivial and superficial.
It was, of course, nothing more than sexism,the especially virulent type espoused bymale techies who sincerely believe that they are too smart to be sexists.
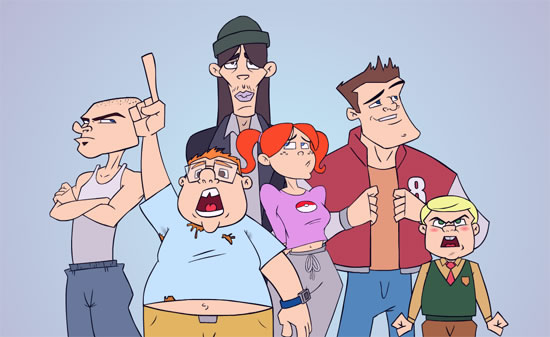
Update: A Reader Responds, and Daddy Takes Him to School in the Car of Pain

Zapp Brannigan, the personification of Mosolotshane’s attitude.
In the comments, a socially developmentally-delayed reader named “Mosolotshane” replied:
Apparently, women are sensitive, delicate creatures who must be shielded from coarse language lest they abandon their dreams of becoming a software developer and seek the shelter of being a stay-at-home-mom.
Before I could reply, one of the other grown-ups, Reg Braithwaite, responded with a great essay, I am Obviously Pissed, on his site. You should read the whole thing, but here’s the meat of his response:
In the 1950s, men did whatever they wanted and women had to put up with it. They also lived according to a strict set of rules about propriety that involved wearing a suit to work, cutting their hair, and so on. And no, they couldn’t say whatever they liked. here were very strict rules about what kind of language was appropriate and what wasn’t, where you could use a word like “whore” and where you couldn’t.
Despite claims to the contrary, if you wore a tie to work you were not expected to make jokes about penises on the job. That was a blue-collar thing to do. Sexy pinups were acceptable at work, if you also wore a hard hat and/or got grease on any part of your clothing.
Now it’s 2013, and you and your kind are trying to have it both ways, you greedy fucks. You want to insult and belittle people just like they did in the 1950s, but you also want to be free to wear whatever you want and say whatever you want in the workplace and/or at conferences where people are working.
There is no free lunch, and I am here to be the adult in your stinking playpen and tell you that. Now, either you invent a time machine and go back to that halcyon time where everyone feared atomic death from the skies, or you embrace the fact that times have changed.
Well put, Reg. I salute you with a filet mignon on a flaming sword!
Thanks to my friend Peach Flambee for the Zapp Brannigan reference!
 With the North American debut of Samsung’s new flagship phone — the Galaxy S4 — coming soon, the advertisements can’t be far off. Stefan Constantinescu has been continually searching YouTube for any Galaxy S4 promos and found some in Samsung’s official YouTube channel for the Netherlands; he links to them over at Android Beat, and I’ve posted them below.