For the moment, it seems that the iPad is the only tablet that matters. While it’s difficult to get a direct measure of the numbers of types of tablets out there, there are a number of ways to approximate those numbers through indirect means.
These numbers come from a sample of “tens of millions” of impressions from Chitika’s ad network seen U.S. and Canadian tablet users from December 8th through 14th, 2012. For every 100 iPad impressions for the aforementioned user base during the aforementioned period, other tablets produced the following numbers of impressions:
Tablet
Number of impressions per 100 iPad impressions
Amazon Kindle Fire
4.88
Samsung Galaxy Tablets
3.04
Google Nexus Tablets
1.22
Asus Transformer
0.93
Barnes & Noble Nook
0.91
Acer Iconia
0.76
Toshiba Thrive
0.60
Motorola Xoom
0.59
Other Android Tablets
0.45
Microsoft Surface
0.22
HP Touchpad
0.18
Unidentifiable Android
0.17
Chitika’s numbers seem to indicate that the iPad family of tablets generate over 87% of U.S. and Canadian tablet web traffic. While this is a slight decrease — it was over 88% a month ago — it looks as though Apple will continue to dominate web traffic for the foreseeable future.
Here’s a graphic created by one A. X. Ian, who goes by @axian on Twitter, showing the results of his search for the phrase “First tweet from” followed by iPad, Kindle, Nexus and Surface:
Ian’s search was performed on Christmas Day, from 5 a.m. to 5 p.m. PST, which he describes as “plenty of time for lots of people to open their presents”. Here’s his count of tweets at the end of the 24-hour sampling period:
The scene in the video above — recorded at Lone Tree, Colorado’s Park Meadows Mall on Black Friday — seems to be playing across the U.S. and Canada, wherever Apple and Microsoft stores are in the same mall. This pretty much captures what’s happening in CTS’ home town of Toronto, where there are both an Apple Store and a Microsoft Store in Yorkdale Mall, as well as in Century City Mall in Los Angeles:
Indirect Metric #4: Go on a Flight and Look Around
I fly about once a month, and both in the lounge and on the plane, I see more and more tablets. Some people do their work, some read, and some bring them as their own personal in-lounge/in-flight entertainment units. No matter what they’re using their tablets for, the one thing that binds them together is that by and large, they’re iPads.
This article also appears in Mobilize!: The CTS Mobile Tech Blog.
Before we get back to the serious business of mobile industry statistics, let’s have a little fun. We’ll share some photos of mobile products that we at CTS most emphatically do not recommend:
The “iPhone8”: Somehow, we suspect that this isn’t an official Apple product — in fact, it’s not even a phone. Looking at this photo, one can almost hear the lawyers in Cupertino sharpening their knives.
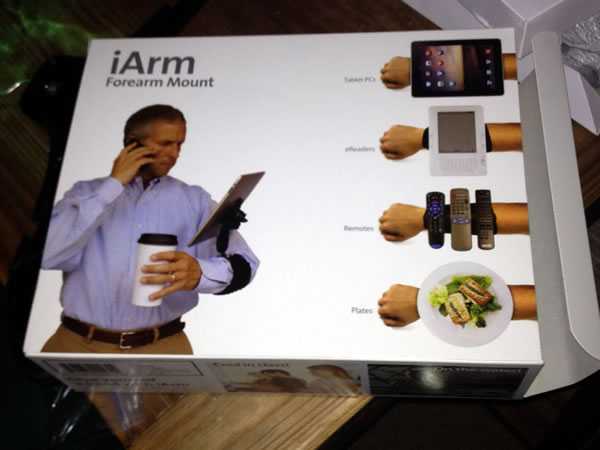
iArm: It probably creates more problems that it purports to solve, but it’s nowhere near as bad an idea as…
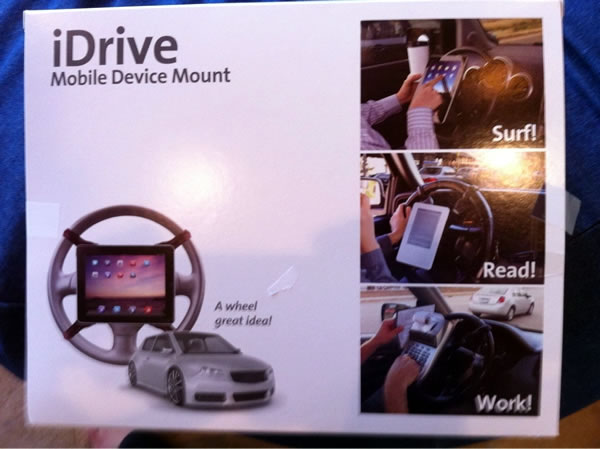
iDrive: We have trouble imagining someone giving this as a gift and thinking “Yes. This will end well.”
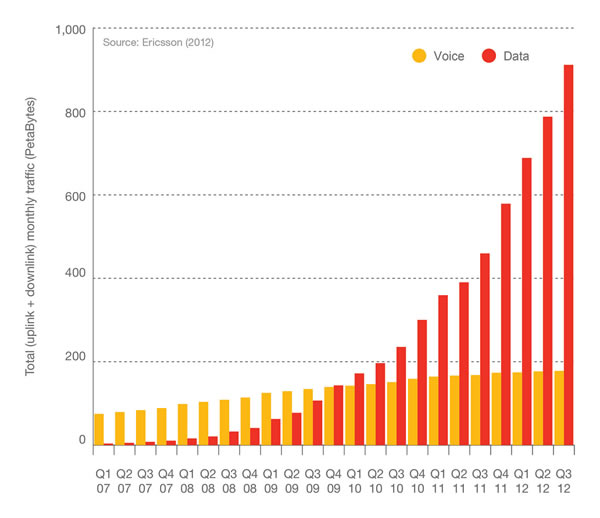
Data in this graph does not include traffic from WiFi, Mobile WiMax or DVB-H.
The graph above comes from Ericsson’s Mobility Report for November 2012 [312MB PDF] and shows the total quarterly mobile voice and data traffic, both up (data sent from the mobile device) and down (data sent to the mobile device), from the start of 2007 to the third quarter of 2012. While mobile voice traffic — represented by the orange bars in the graph above — climbs at a slow, steady and linear rate, mobile data traffic — the red bars — is rocketing at a rate closer to exponential.
The traffic is expressed in petabytes. For those not familiar with that unit of measure, a petabyte is…
one quadrillion, or 10^12 bytes or
1,000 terabytes or
1,000,000 gigabytes or
the total combined storage capacity of almost 16,000 64GB phones or 32,000 32GB phones or 64,000 16GB phones.
As you can see from the graph, we’re not all that far off from having to measure quarterly traffic in exabytes (one quintillion, or 10^15 bytes).
The world’s technological capacity to store information grew from 2.6 (optimally compressed) exabytes in 1986 to 15.8 in 1993, over 54.5 in 2000, and to 295 (optimally compressed) exabytes in 2007. This is equivalent to less than one 730-MB CD-ROM per person in 1986 (539 MB per person), roughly 4 CD-ROM per person of 1993, 12 CD-ROM per person in the year 2000, and almost 61 CD-ROM per person in 2007. Piling up the imagined 404 billion CD-ROM from 2007 would create a stack from the earth to the moon and a quarter of this distance beyond (with 1.2 mm thickness per CD).
The world’s technological capacity to receive information through one-way broadcast networks was 432 exabytes of (optimally compressed) information in 1986, 715 (optimally compressed) exabytes in 1993, 1,200 (optimally compressed) exabytes in 2000, and 1,900 in 2007.
According to the CSIRO, in the next decade, astronomers expect to be processing 10 petabytes of data every hour from the Square Kilometre Array (SKA) telescope.[11] The array is thus expected to generate approximately one exabyte every four days of operation. According to IBM, the new SKA telescope initiative will generate over an exabyte of data every day. IBM is designing hardware to process this information.
This article also appears in Mobilize!: The CTS Mobile Tech Blog.
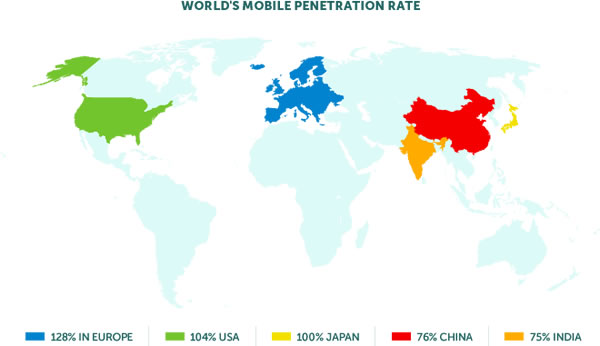
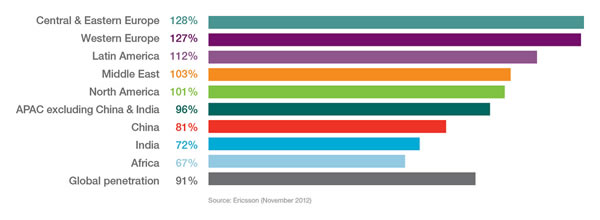
Parseco have posted an article based on data from the European Mobile Industry Observatory and mobiThinking that looks at mobile penetration worldwide. As you can see from the map above, the established economic powers of the late 20th century have either hit or exceeded full mobile penetration, and the emerging powers of India and China, who collectively have 2 billion people, are three-quarters of the way there already.
As I mentioned in yesterday’s post, a penetration rate greater than 100% means that on average, people have more than one mobile subscription. Europe boasts the highest rate of penetration worldwide, and that’s not surprising: it’s not unusual to see someone with two mobile phones or constantly swapping SIMs with a single phone.
Here are some of the subscriber numbers and penetration rates that they report for various regions:
…and here’s the estimated number of mobile subscriptions, which includes “post-paid” accounts and accounts with pre-paid SIMs:
Remember that we’re counting subscriptions and not subscribers. There are a number of people in the world with more than one mobile subscription (myself included — I have the “mobile dev special”, with three mobile phone accounts), especially in the emerging world, where it’s not uncommon to see people with a “deck” of prepaid SIM cards, which they swap in and out of their phone depending on the circumstances and whom they’re calling.
Ahonen says that the mobile industry added 700 million new paying mobile subscriptions this year — 11% growth and three times the installed base of all tablets (the iPad and all its competitors combined).
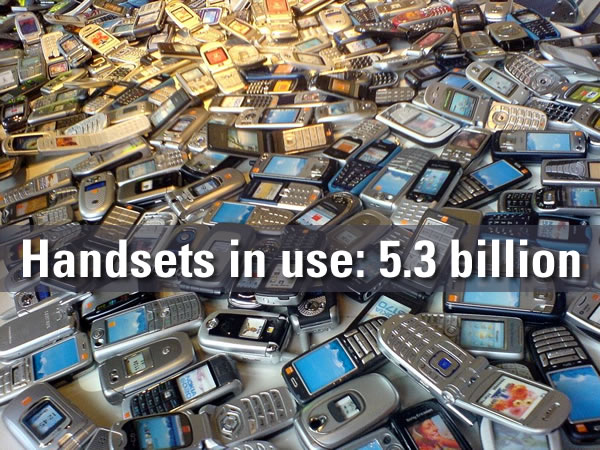
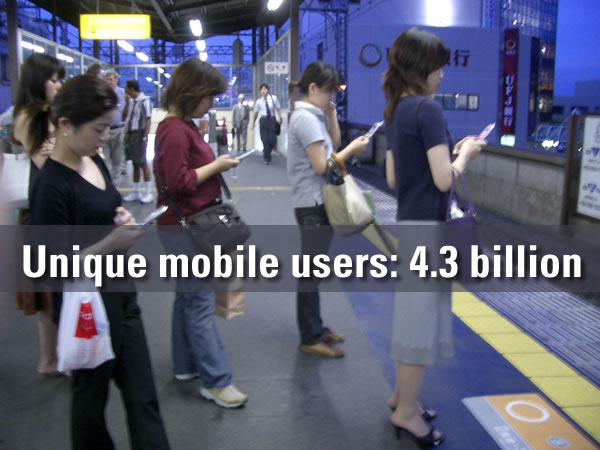
He reports that there are currently 5.3 billion handsets being used by 4.3 billion people. This means that the average person has 1.23 handsets (I myself have two; an iPhone 4S and Samsung Galaxy S III) and that about six out of ten people have a mobile device handy, connected to a mobile network.
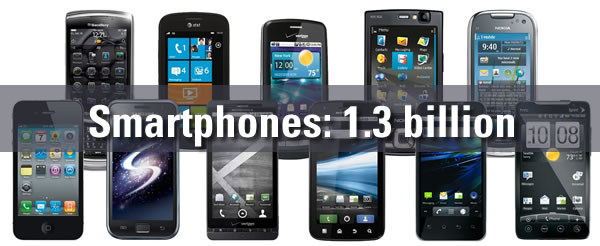
1.3 billion of the 5.3 billion mobile phones today are smartphones — that’s about 25% of the total population. That makes for a mere 25% of the mobile phone market, meaning that there are still many opportunities for mobile app developers out there; the market’s still largely untapped!


 Tomi Ahonen is one of the mobile industry gurus to whom I regularly pay attention. He’s an ex-Nokia exec now based in Hong Kong, and he’s forgotten more about the mobile industry than most people will learn. His stature in the field is such that