Do you remember O’Reilly’s “Head First” series of books?
 For a shining period between 2003, when Head First Java was first released, and around around 2014, when it seemed that no new “Head First” books would ever be written again, they were the books I’d refer people to, regardless of their level of expertise. Unlike most technical books, which seem to be modeled after academic texts, the “Head First” series took an unorthodox route and used visuals, humor, storytelling, and a conversation style to get you hooked and keep you engaged, even when the topics got dense and tedious.
I’m pleased to report a couple of tidbits of good news on the “Head First” front:
- There are new “Head First” books out again! Head First Agile was released last year, and Head First Go is currently in production.
- There’s a data science book that’s written with the same spirit and style as the “Head First” series, and better yet — it’s free-as-in-beer!
At last, a “Head First” book on data science!
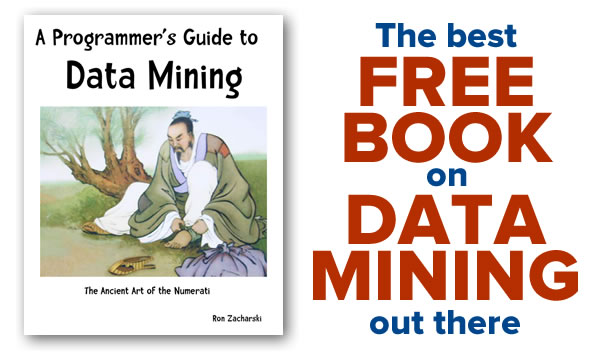
A Programmer’s Guide to Data Mining: The Ancient Art of the Numerati is not an O’Reilly book, nor is it part of the “Head First” series of books, but it’s the next best thing if you want to get into data science, and especially if you want to do so on a budget.
It’s free in a couple of ways:
- It’s free-as-in-beer. That means it won’t cost you any money to download it legally. Go ahead, go download it, and you can also get your hands on the companion code and data.
- It’s also free-as-in-speech. It’s licensed under a Creative Commons Attribution Noncommercial license, which gives me (and also you) the freedom to share and adapt the work, as long as it’s for non-commercial purposes.
It’s also fun. Here’s a sampling of the visuals in the book, which should give you an idea of what it’s like to read it and go through its exercises:
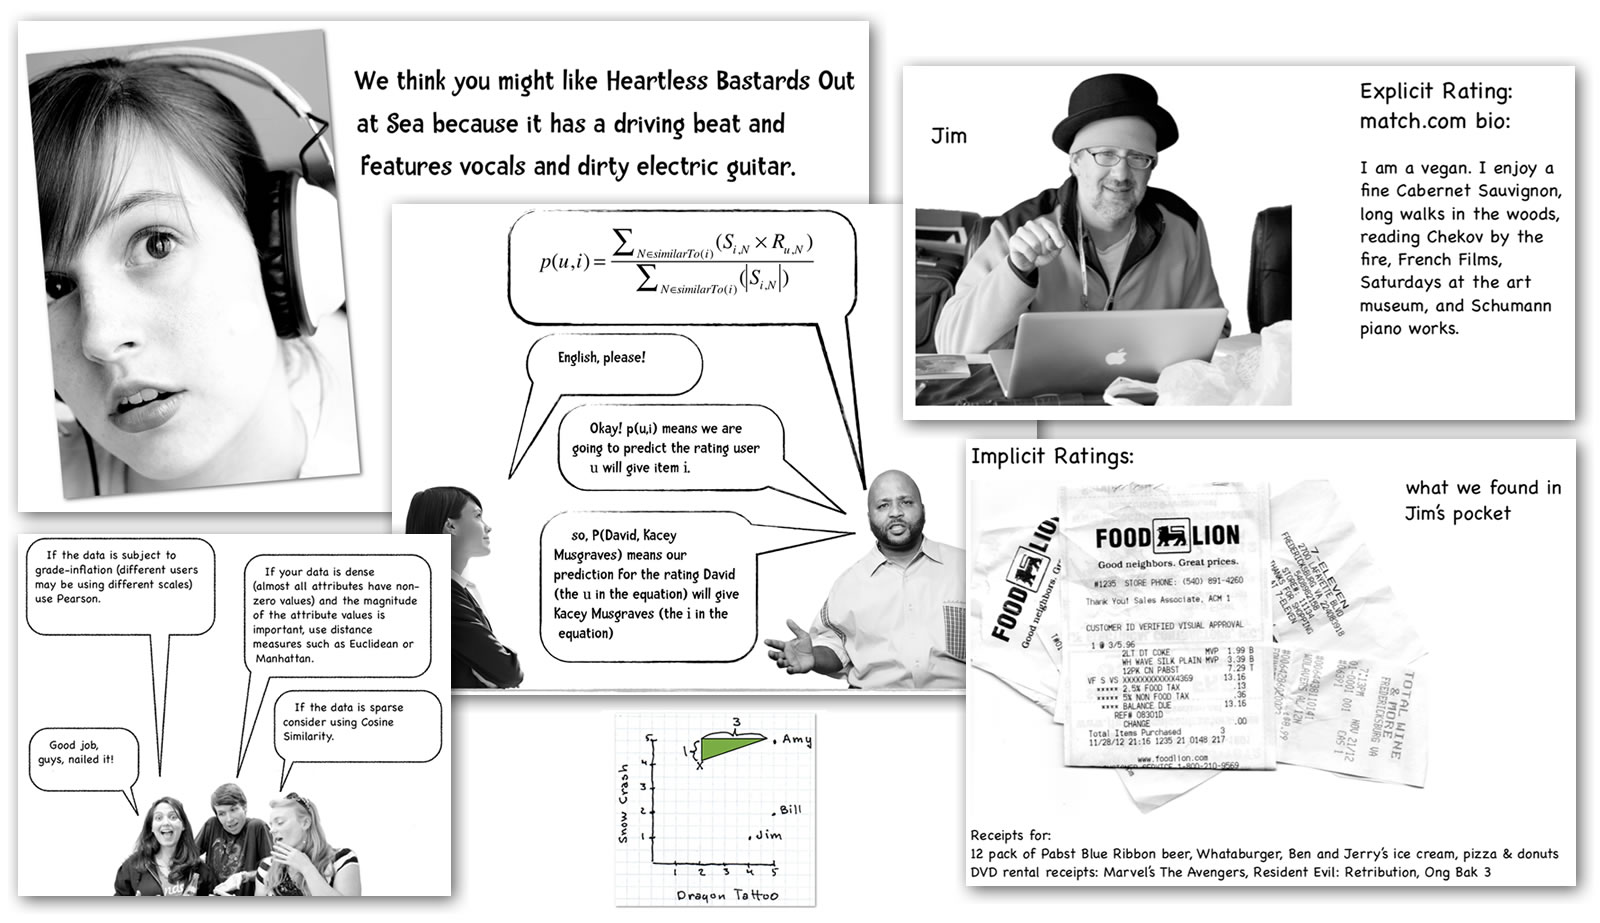
Click the image to see it at full size.
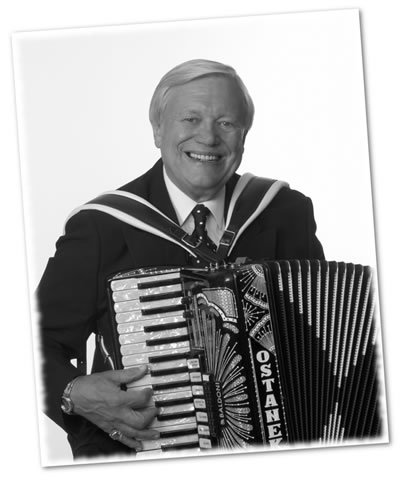
You’ve got to hand it to a book that’s not afraid to not just show an accordion, but show an accordion belonging and attached to the great Walter Ostanek, Canada’s accordion-playing polka king, and three-time, three-years-in-a-row winner of the Grammy award for the best polka album:
The book is hardly new. The first edition made an appearance some five years ago, and it was generally well-received by the rather picky-and-pedantic readers on Hacker News. Still, it’s a worthwhile read, and it remains my favorite of all the free introductory data science material out there.
What you’ll need (aside from the book)
I’ll be going through the book from start to finish, and I’ll post articles along the way.
I’ll get the big warning out of the way first:
There will be math.
There’s no getting around it. Data science is an extension of math, and you’ll need to recall (or learn for the first time) Cartesian math, sigma notation, probability, statistics, and other goodies from the great bag of tricks that mathematics provides. The book does a decent job of explaining the math behind its methods, and as the author puts it:
Here’s a personal confession. I have a Bachelor of Fine Arts degree in music. While I have taken courses in ballet, modern dance, and costume design, I did not have a single math course as an undergrad. Before that, I attended an all boys trade high school where I took courses in plumbing and automobile repair, but no courses in math other than the basics. Either due to this background or some innate wiring in my brain, when I read a book that has formulas like the one above, I tend to skip over the formulas and continue with the text below them. If you are like me I would urge you to fight that urge and actually look at the formula. Many formulas that on a quick glimpse look complex are actually understandable by mere mortals.

You’ve probably guessed that the programming language used in the book is either R or Python (or perhaps a combination of the two). For this book, the programming language is Python, and it’s pretty much plain ol’ Python without the use of packages like NumPy, SciPy, Pandas, and so on.
In working through the exercises in the book, I came up with improvements to the author’s code, and I’ll share them with you. Who knows — you just might come up with improvements on my improvements!
And finally, you’ll need patience. Data science takes the patience requirements of programming and brings it to a whole new level by providing even more rabbit holes that you’ll have to go down, and more dead ends to run into.
Your first assignment
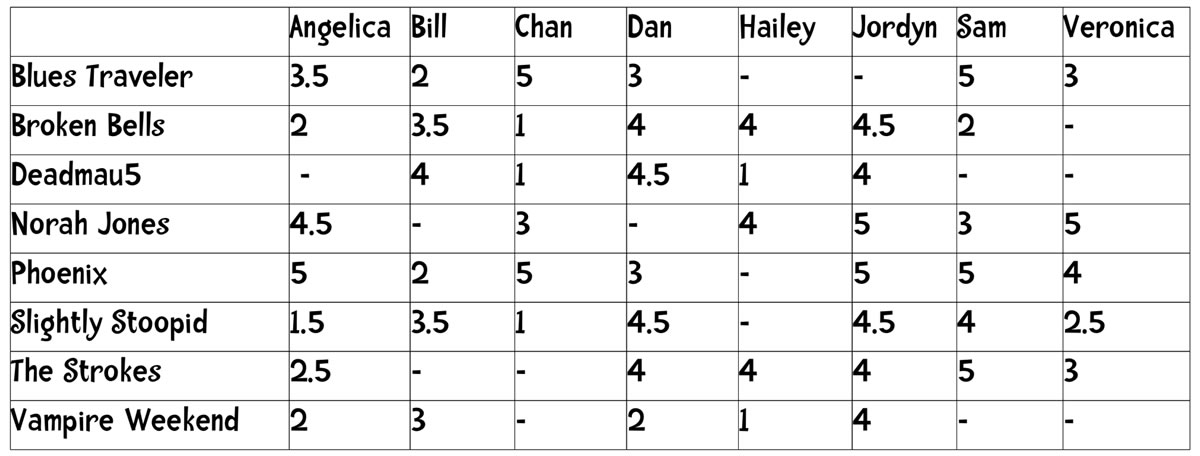
Click the table to see it at full size.
Read the first chapter (the obligatory “welcome to the book” chapter), followed by pages 2-1 through 2-20 of A Programmer’s Guide to Data Mining: The Ancient Art of the Numerati. You’ll see the table above a number of times, with its first appearance on page 2-7.
This table contains a set of ratings that 8 people gave for 8 bands, on a scale of 1 to 5, where 1 means “hate them” and 5 means “love them”. You can see that Dan is a really big fan of Joel Zimmerman (a former Flash programmer from Toronto who’s now better known by his DJ name, Deadmau5), while Chan and Hailey couldn’t care less about his music. Chan is a big fan of Blue Traveler and Phoenix, and you can see that Hailey is a love-’em-or-loathe-’em kind of music fan, giving either 4s or 1s in her band ratings.
Your first assignment is to write Python functions that:
- Determine how similar the musical tastes of any two people on this table are.
- Given two people A and B who have at least one band in common, recommend bands to A by listing all the bands that B has rated that A hasn’t rated.
As a starting point, here’s the data structure you’ll be working with: the table above, expressed as a dictionary of dictionaries, and with an additional person added to the mix — “GrungeBob”, who’s stuck in Lollapalooza 1992 and listens only to the holy trinity of grunge: Nirvana, Pearl Jam, and Soundgarden…
users = {
    "Angelica": {
        "Blues Traveler": 3.5,
        "Broken Bells": 2.0,
        "Norah Jones": 4.5,
        "Phoenix": 5.0,
        "Slightly Stoopid": 1.5,
        "The Strokes": 2.5,
        "Vampire Weekend": 2.0
    },
    "Bill": {
        "Blues Traveler": 2.0,
        "Broken Bells": 3.5,
        "Deadmau5": 4.0,
        "Phoenix": 2.0,
        "Slightly Stoopid": 3.5,
        "Vampire Weekend": 3.0
    },
    "Chan": {
        "Blues Traveler": 5.0,
        "Broken Bells": 1.0,
        "Deadmau5": 1.0,
        "Norah Jones": 3.0,
        "Phoenix": 5,
        "Slightly Stoopid": 1.0
    },
    "Dan": {
        "Blues Traveler": 3.0,
        "Broken Bells": 4.0,
        "Deadmau5": 4.5,
        "Phoenix": 3.0,
        "Slightly Stoopid": 4.5,
        "The Strokes": 4.0,
        "Vampire Weekend": 2.0
    },
    "Hailey": {
        "Broken Bells": 4.0,
        "Deadmau5": 1.0,
        "Norah Jones": 4.0,
        "The Strokes": 4.0,
        "Vampire Weekend": 1.0
    },
    "Jordyn": {
        "Broken Bells": 4.5,
        "Deadmau5": 4.0,
        "Norah Jones": 5.0,
        "Phoenix": 5.0,
        "Slightly Stoopid": 4.5,
        "The Strokes": 4.0,
        "Vampire Weekend": 4.0
    },
    "Sam": {
        "Blues Traveler": 5.0,
        "Broken Bells": 2.0,
        "Norah Jones": 3.0,
        "Phoenix": 5.0,
        "Slightly Stoopid": 4.0,
        "The Strokes": 5.0
    },
    "Veronica": {
        "Blues Traveler": 3.0,
        "Norah Jones": 5.0,
        "Phoenix": 4.0,
        "Slightly Stoopid": 2.5,
        "The Strokes": 3.0
    },
    "GrungeBob": {
        "Nirvana": 4.5,
        "Pearl Jam": 4.0,
        "Soundgarden": 5.0
    },
}
You’ll make use of the following concepts, which are covered in pages 2-1 through 2-20:
- Manhattan distance
- Euclidean distance
- Minkowski distance
Good luck, and watch this space for the next installment of I will teach you data science!
Download A Programmer’s Guide to Data Mining: The Ancient Art of the Numerati here.
2 replies on “I will teach you data science, part 1: The best free book on data mining out there”
[…] The previous article. It’s a good introduction to the series. […]
[…] Read More […]