
Recently, in a fit of annoyance about some big players in tech and particularly AI, I posted the slide featured above across my usual social media channels, and it caught the attention of none other than Jeff Atwood, co-founder of Stack Exchange and Stack Overflow, creator of the Discourse discussion forums platform, and of course, author of the blog Coding Horror. Nowadays, he’s doing a lot of good deeds.
He asked for a link to the slide deck, which I shared, after which he said that I should post in a more web-friendly format. I thought it was a good idea, and I told him I’d do just that.
(We had this conversation on Mastodon, which you can see here.)
Since mine was going to be the third of three presentations at an event that was also a cocktail party, I decided to go a little less tech-heavy, a little more “here’s what you might need to brush up on,” and pay a lot of attention to a topic that’s usually a footnote in AI presentations: ethics.
Here are the slides and notes. My presentation was the third of three given at the SocialCode x Tampa event held on September 7, 2023. There’s not much online about it — most of what you can find was written by Yours Truly, including this “save the date” blog post.
Fun fact: It was at SocialCode x Tampa that I hastily improvised what is now the “official unofficial” AI anthem:
The slides and notes
Hello, and welcome to the slide deck from my presentation at the SocialCode x Tampa event that took place on Thursday, September 7, 2023 at Hyde Park Public Studio in Tampa, Florida, USA!
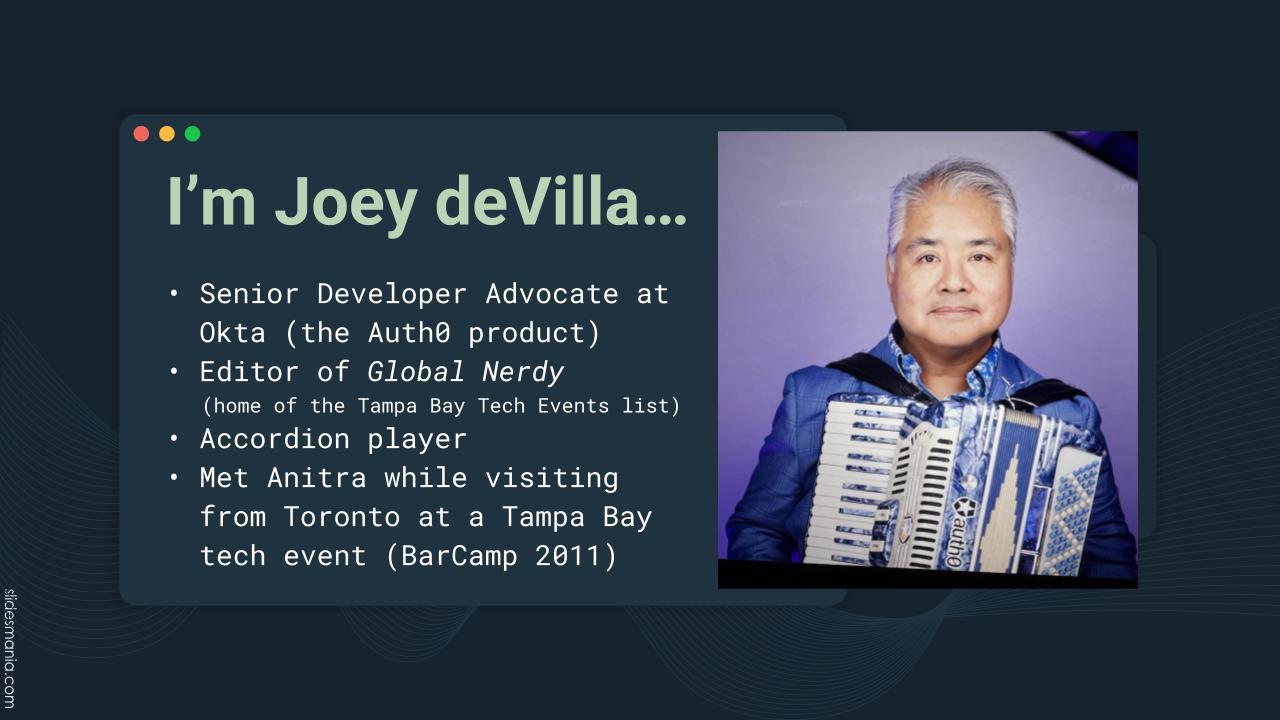
The mandatory speaker bio slide. If you were wondering, my headshot comes from Vadim Davydov, an amazing headshot photographer based here in Tampa Bay. You can find out more about him at https://vadimdavydov.com/.
[ Editorial note: At the time of writing, I am NOT a Senior Developer Advocate for Auth0 by Okta, but I could be YOUR Senior Developer Advocate, because I’m looking for work! If you’re curious, here’s my LinkedIn profile, and here’s my developer relations portfolio. ]
What’s the point of AI? Why do we want to build machines that could render us useless or might even try to eliminate us in the first place?
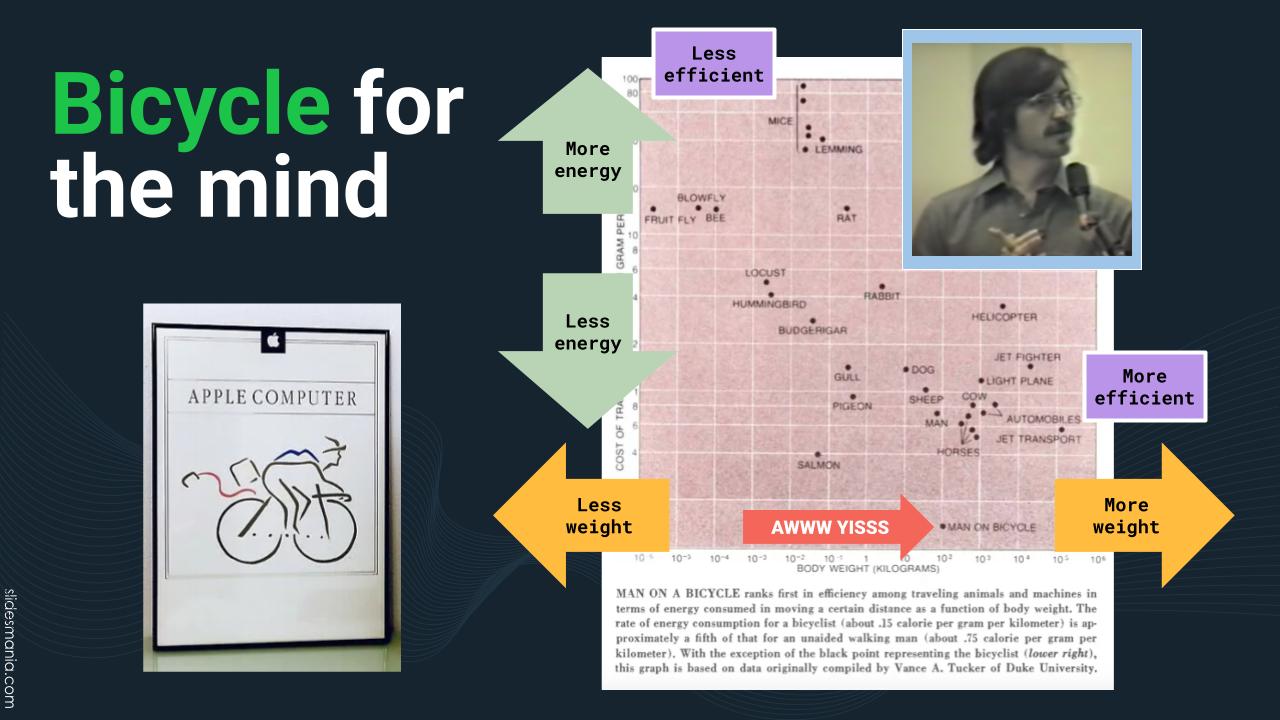
I like Steve Jobs’ metaphor for computers: “Bicycle for the mind.”
Jobs liked to reference a Scientific American article featuring a study of the energy-efficiency of motion for various species. Unaided, humans were pretty inefficient — until you put a human on a bicycle. When that happens, the human becomes the most energy-efficient species.
Just as a bike augments a human’s body, a computer augments a human’s mind.
Here’s a video featuring Jobs explaining his “bicycle for the mind” philosophy.
Let me do just that.
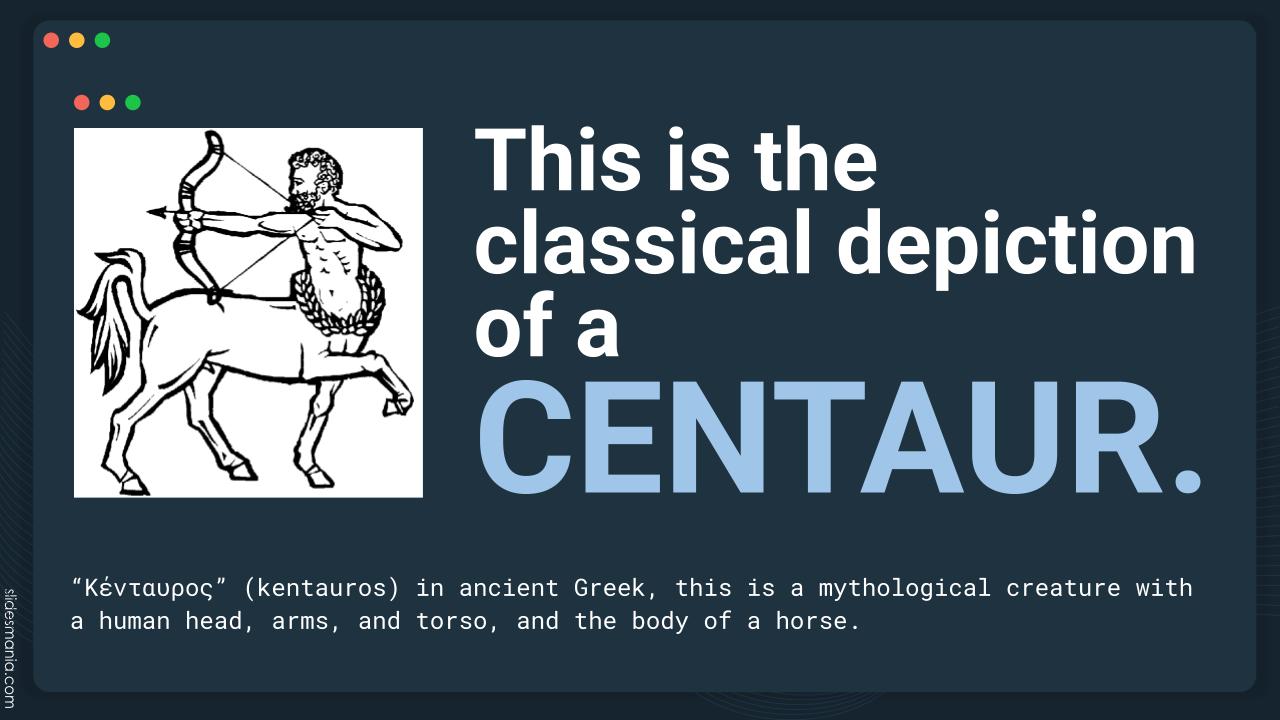
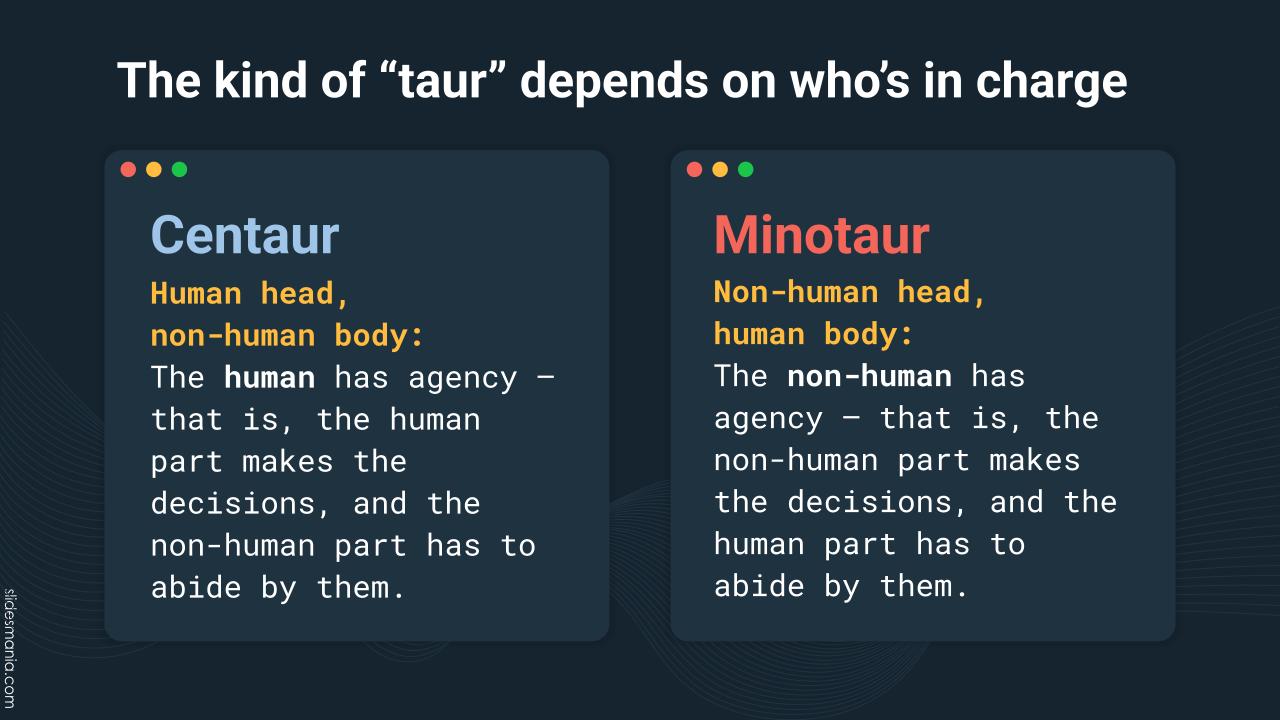
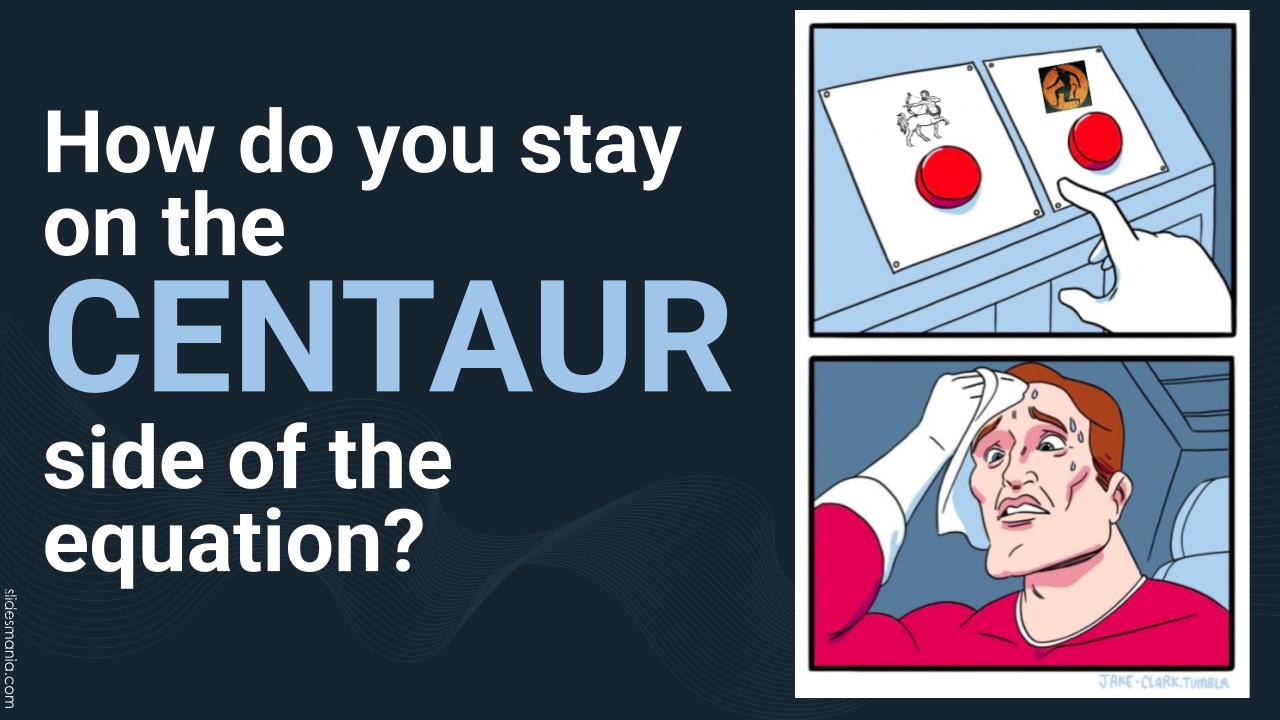
From greek mythology, a centaur is like a horse, but with a human head, arms, and torso where the horse’s head would normally be.

The reverse version wasn’t as popular.

“Centaur chess” is Kasparov’s term for a human playing chess with the assistance of a chess program. The human still makes the final decision about chess moves, and uses the computer to try out possible moves and see what the consequences could be.
For more, see the Advanced Chess entry in Wikipedia.
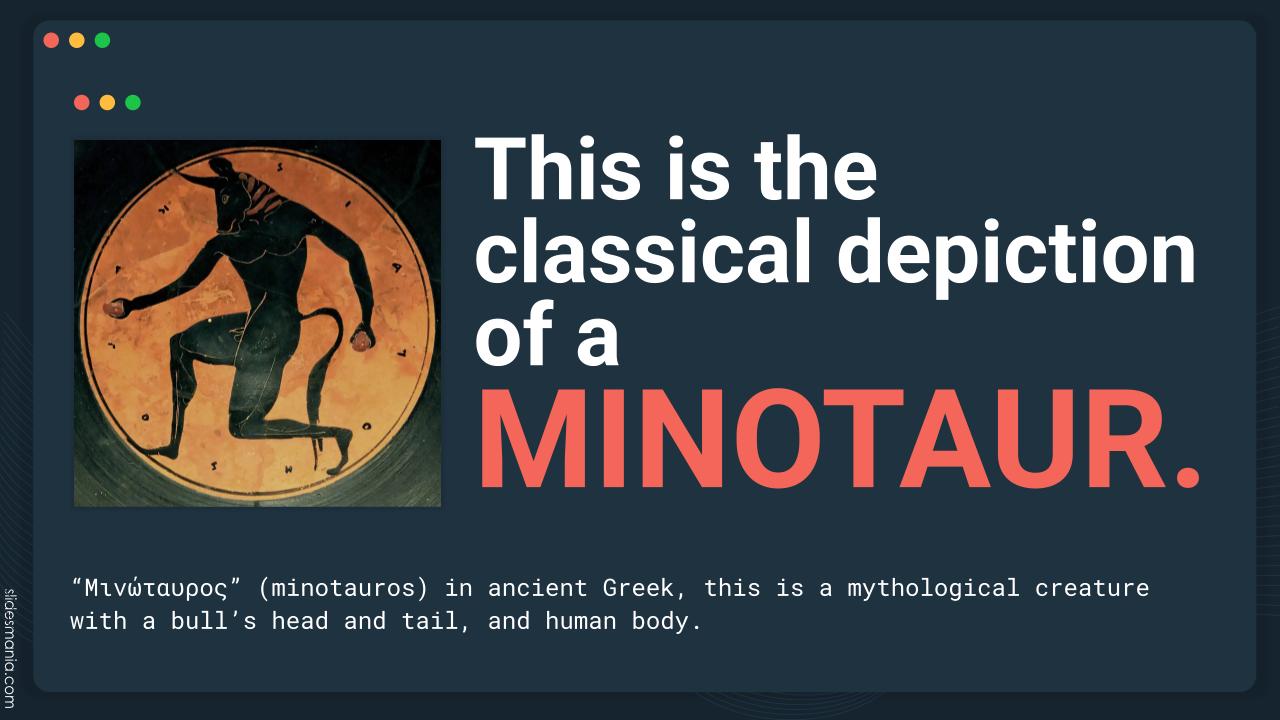
The minotaur is the closest thing to reverse centaur.
In AI terms, the minotaur is the “opposite” of the centaur. The centaur is a human head in charge of a non-human body, while the minotaur is a non-human head directing a human body. For a “minotaur” AI/human combination, the AI directs the human.
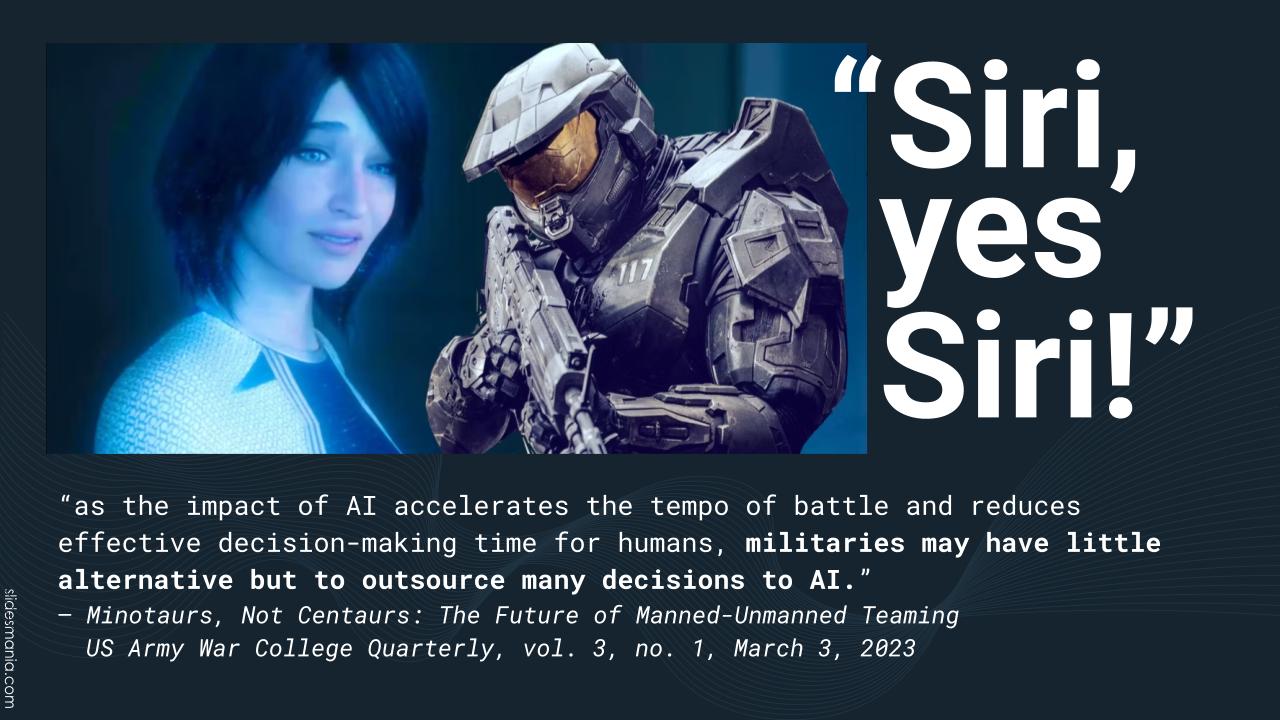
I’d much rather be in a “centaur” relationship with an AI than in a “minotaur” one. I feel bad for soldiers of the future, because there are military thinkers suggesting that the future of warfighting isn’t soldiers ordering machines around, but machines ordering soldiers around.
Check out this article, Minotaurs, Not Centaurs: The Future of Manned-Unmanned Teaming.
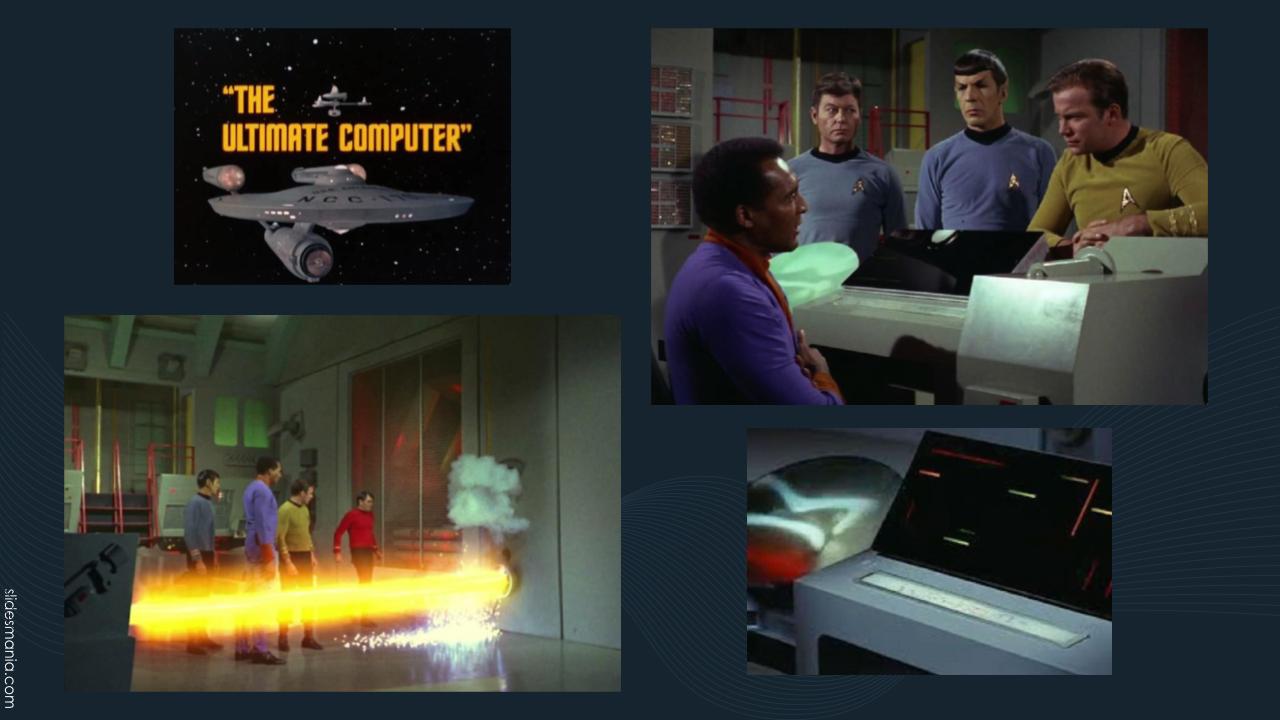
We’ve had “minotaur warfighting” scenarios in science fiction for decades. One of the best known examples is the Star Trek (original series) episode where Starfleet equips the Enterprise with an AI that then proceeds to attack all other ships, even though those ships are on the same side. Captain Kirk had to talk the AI into committing suicide!
Here’s TV Tropes’ summary of the episode. The original notes for this presentation had a link to a copy of the episode on Dailymotion, but that’s been taken down; here’s a video summary of the episode.
For more on this topic, see the article Humans + AI: Do we want to be Centaurs or Minotaurs?
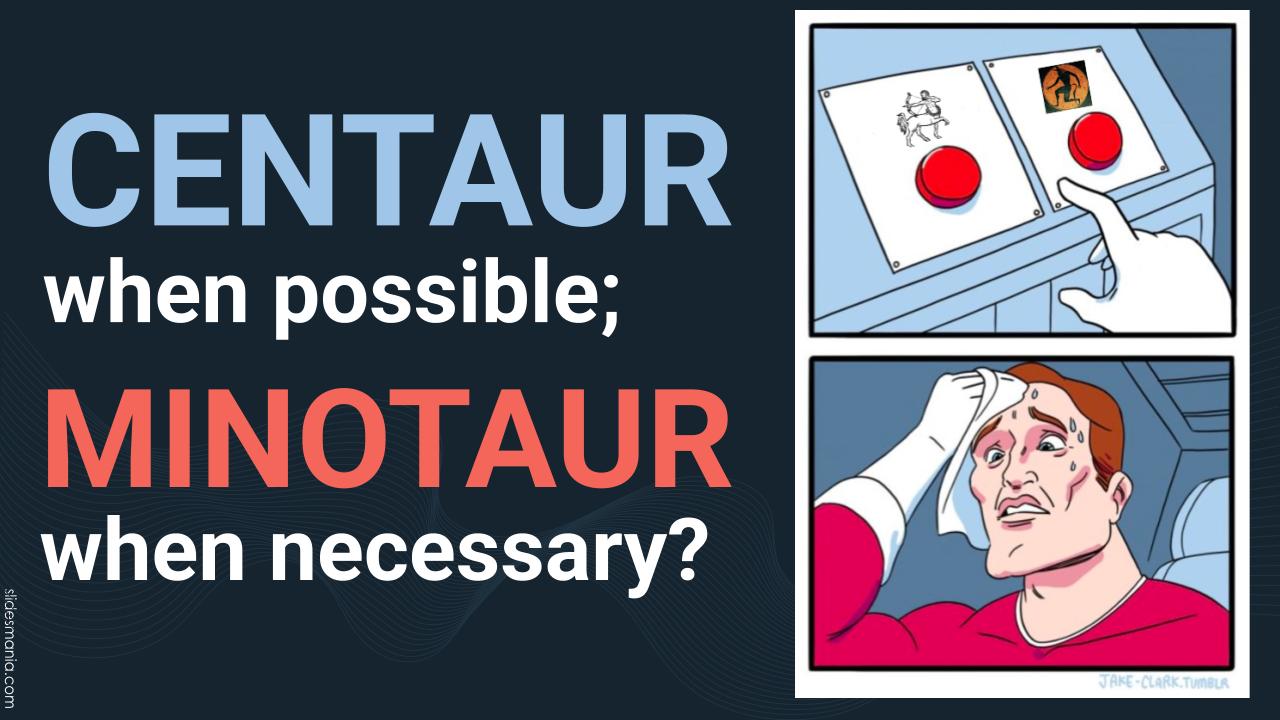
Ideally, I’d like my relationship with AI to be centaur-like when possible, and only minotaur-like when necessary.

In fact, I’d like to be the best Centaur: Chiron. He was respected and taught many Greek gods!
Note the look on Achilles’ face in the painting. It looks like he’s saying “I don’t think that this is an appropriate student-teacher relationship.”
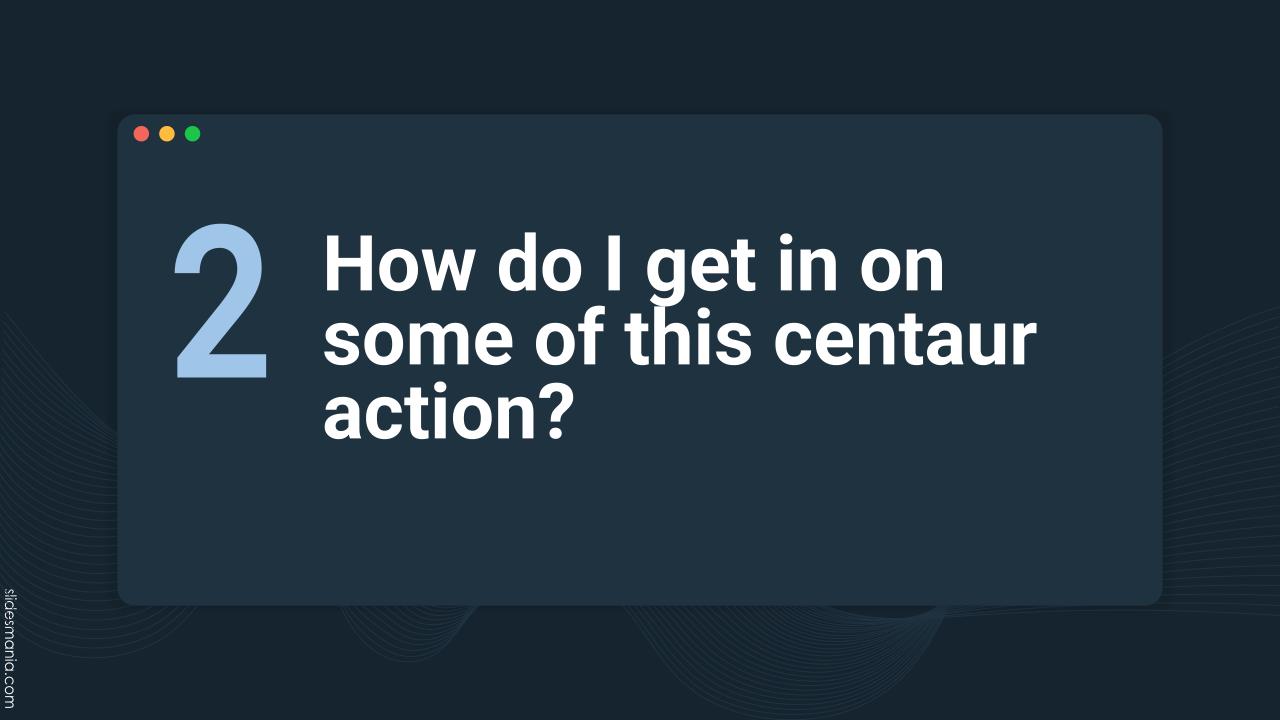
And here we get to the main point of this presentation — how does one get in on some of this sweet, sweet AI action and some of that sweet, sweet AI money? By being in a centaur relationship with AI, or better still, by building AI. How?
I want to flip the standard AI presentation upside-down and start with what’s often a footnote: Ethics. You’ll find that there are some AI “thought leaders” actively fighting against AI ethics, claiming that it’s an unnecessary restriction of progress (and I’ll name and shame one in a few slides).

Let me cite the infamous Boston Housing Dataset. It’s been around for a long time and has been one of the standard datasets that beginning data and AI scientists use; it’s featured in all sorts of tutorials on working with real-world data.

The dataset was used for a 1970s paper titled Hedonic housing prices and the demand for clean air. “Hedonic” is a fancy-schmancy word for “having to do with pleasure,” and the paper was basically about how air pollution affected housing prices.

Air quality in the US used to be terrible in the 1960s and 1970s. It’s so much better today thanks to the EPA and the Clean Air Act, which in turn are thanks to…President Richard Nixon!
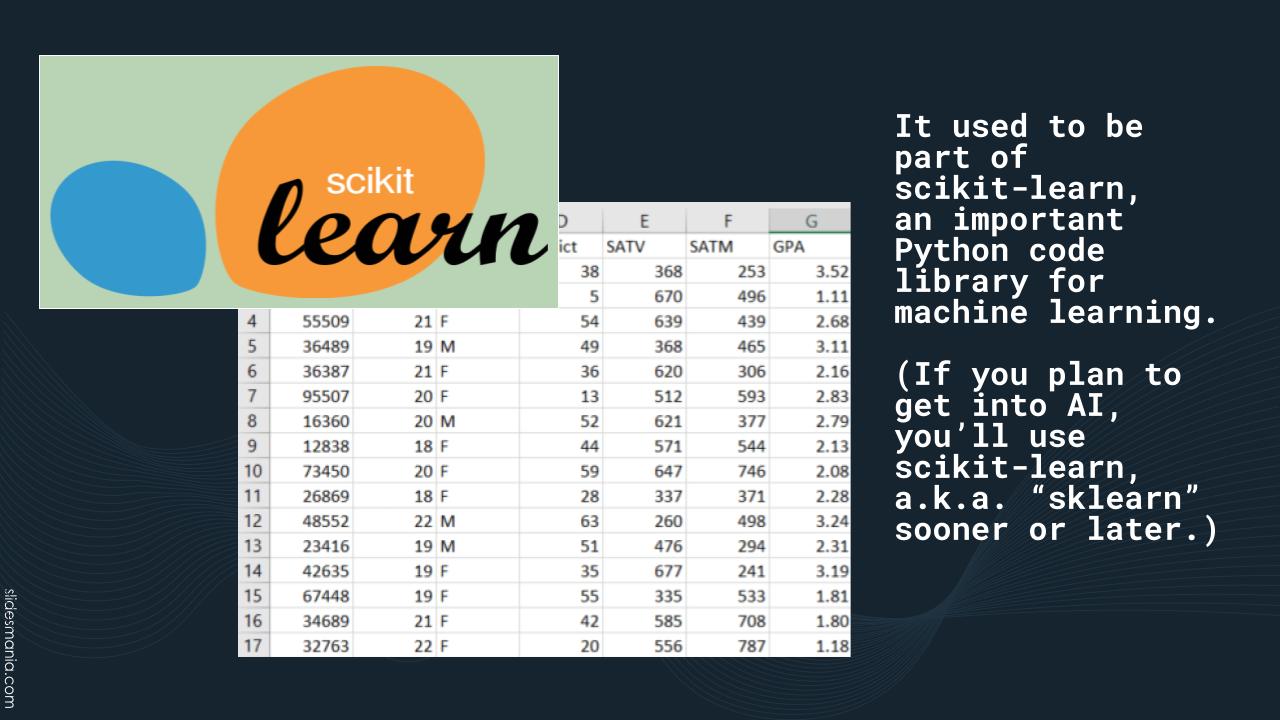
If you’re going to do data science or AI development in Python, you’ll eventually use scikit-learn, a library with all sorts of functions for machine learning.
To help people who are new to data science or scikit-learn, it comes with a number of built-in datasets for you to work on, and one of them was Boston Housing Prices.
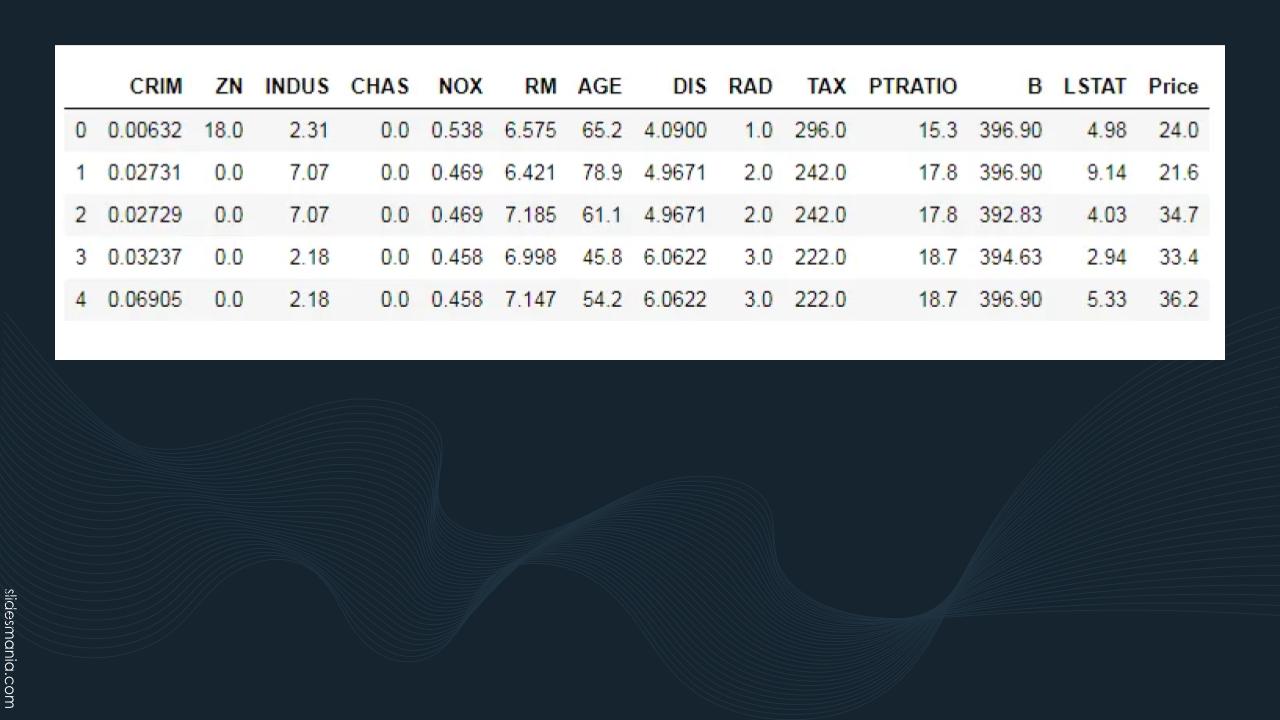
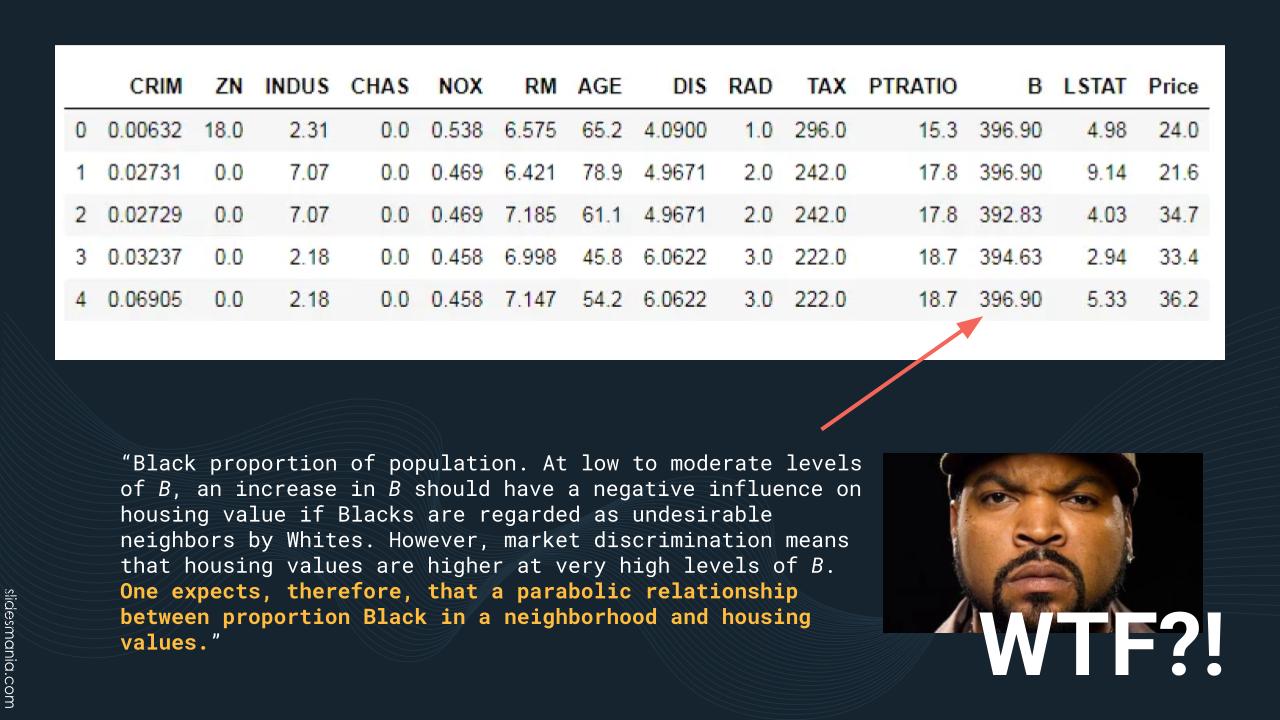
Here’s a table showing the first 5 rows of the dataset. It seems innocent enough at first glance…
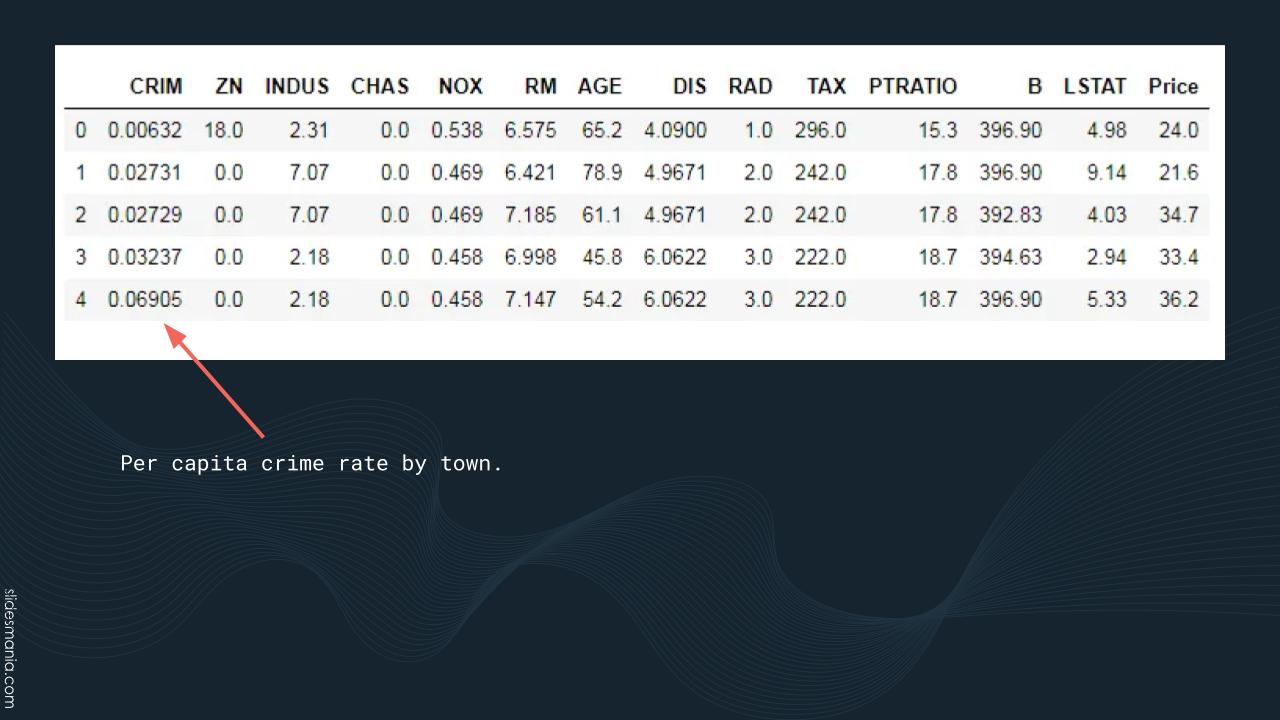
Like many datasets, the columns names are short. The CRIM column is short for “Per capita CRIMe” rate by town.
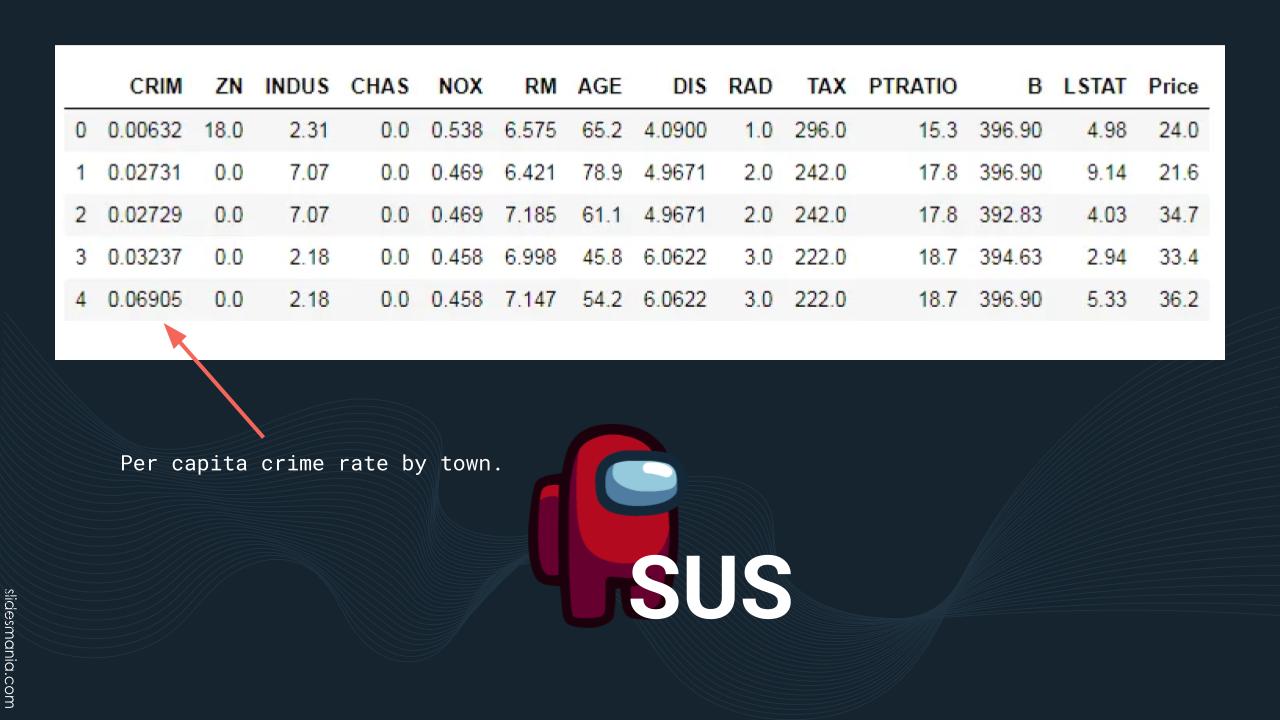
A little suspicious. I’m going to mark it as such. (Remember, this is about the relationship between housing prices and air quality.)
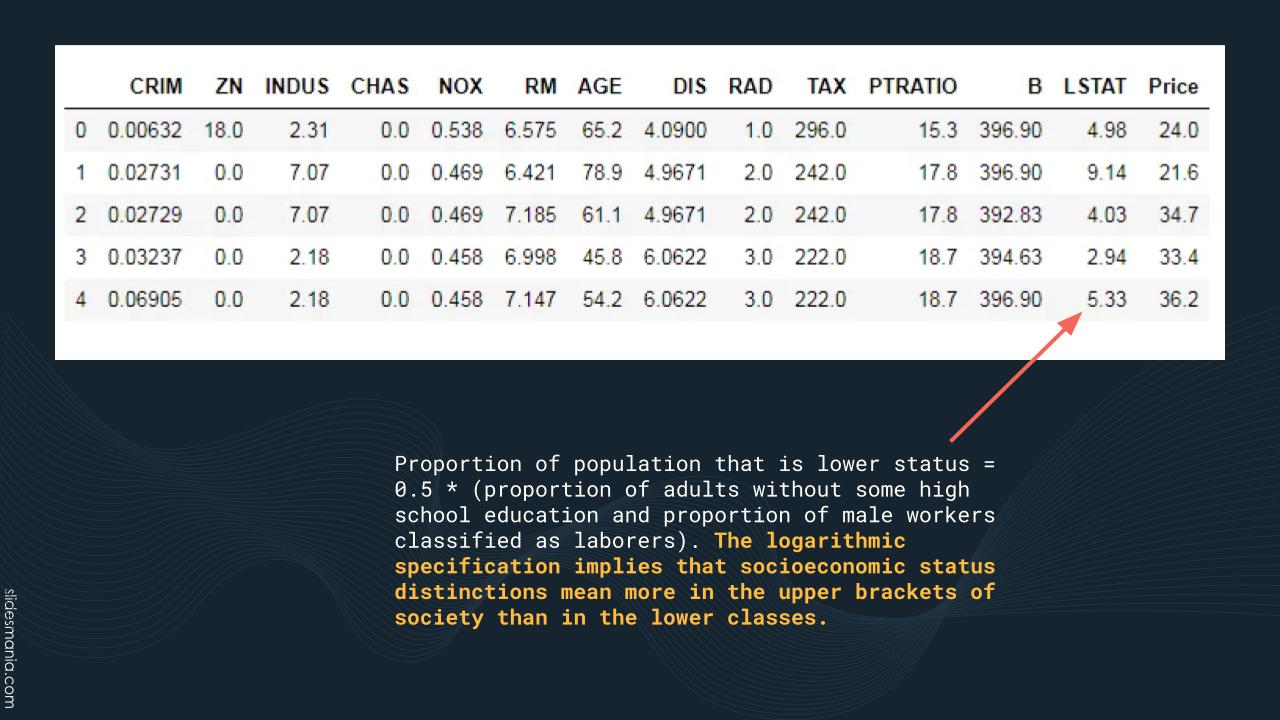
Then there’s the column named LSTAT, which is short for “Lower STATus,” where “lower status” means “a combination of people who didn’t get at least some time in high school and blue collar guys.”
Again: Housing prices. Air quality.
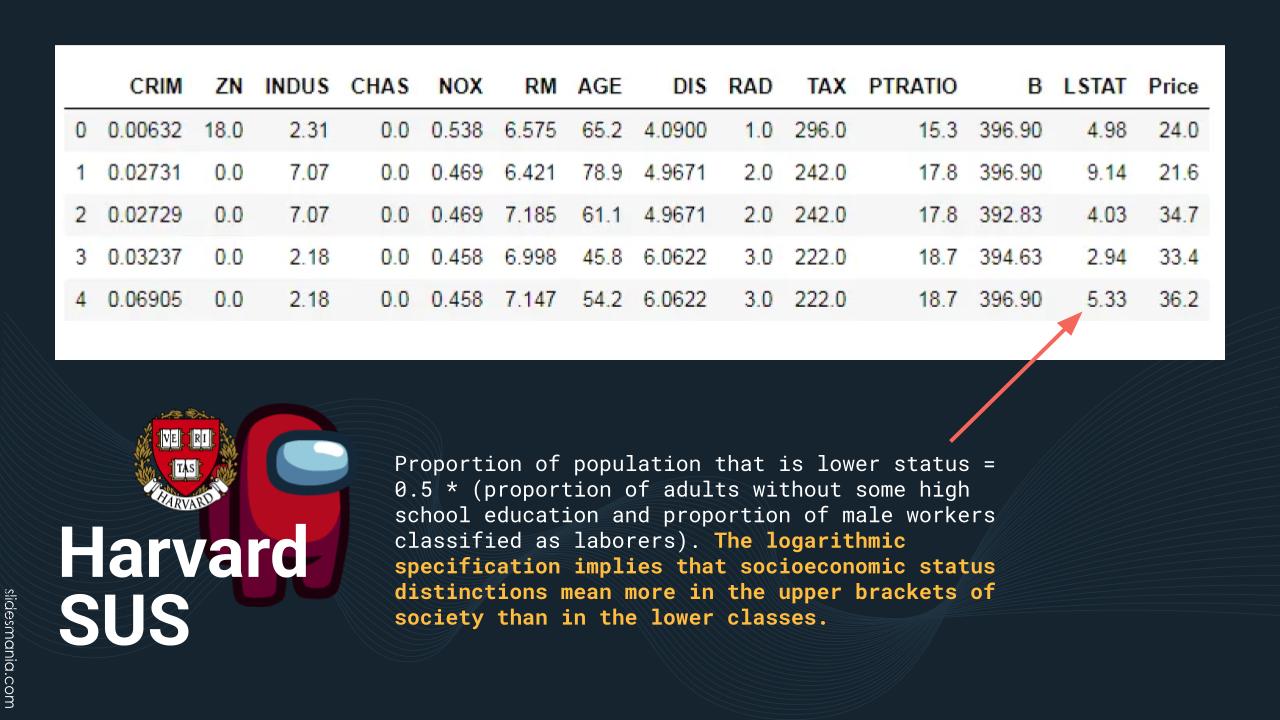
That’s not just suspicious, but HARVARD suspicious. The worst kind of suspicious.
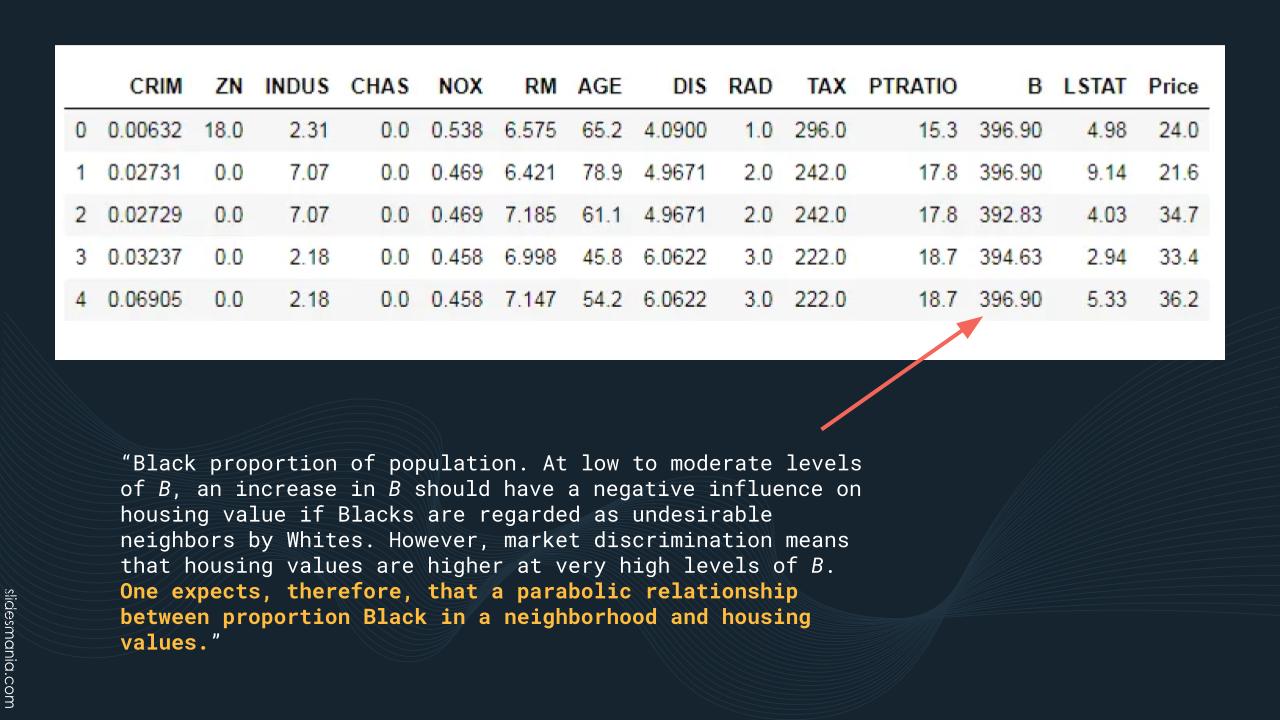
And then there’s the column simply known as “B”, which is described above. Read the description — then READ IT AGAIN, just to be sure:
“Black proportion of population. At low to moderate levels of B, an increase in B should have a negative influence on housing value if Blacks are regarded as undesirable neighbors by Whites. However, market discrimination means that housing values are higher at very high levels of B. One expects, therefore, that a parabolic relationship between proportion Black in a neighborhood and housing values.”
To quote M Carlisle, who summarized the big problem with the Boston Housing Prices dataset in the article racist data destruction?
This actually is a parameter in the model to modulate house pricing for systemic racism.
When I say ‘systemic racism’ here, I mean this mathematically. This is a term, in a statistical model to predict housing prices, that accounts for racism as a factor in pricing. If this is used to predict, or even influence future models by its very existence, then systemic racism will continue to be a pricing factor.
This bit earns more than a mere SUS. I’m giving it the Ice Cube WTF.
Now if you look at the values in the “B” column, they’re in the 390s. Does this mean that B is reporting the Black proportion of the population expressed as units of thousandths, where 0 = a complete lack of Black people and 1000 = everyone is Black?
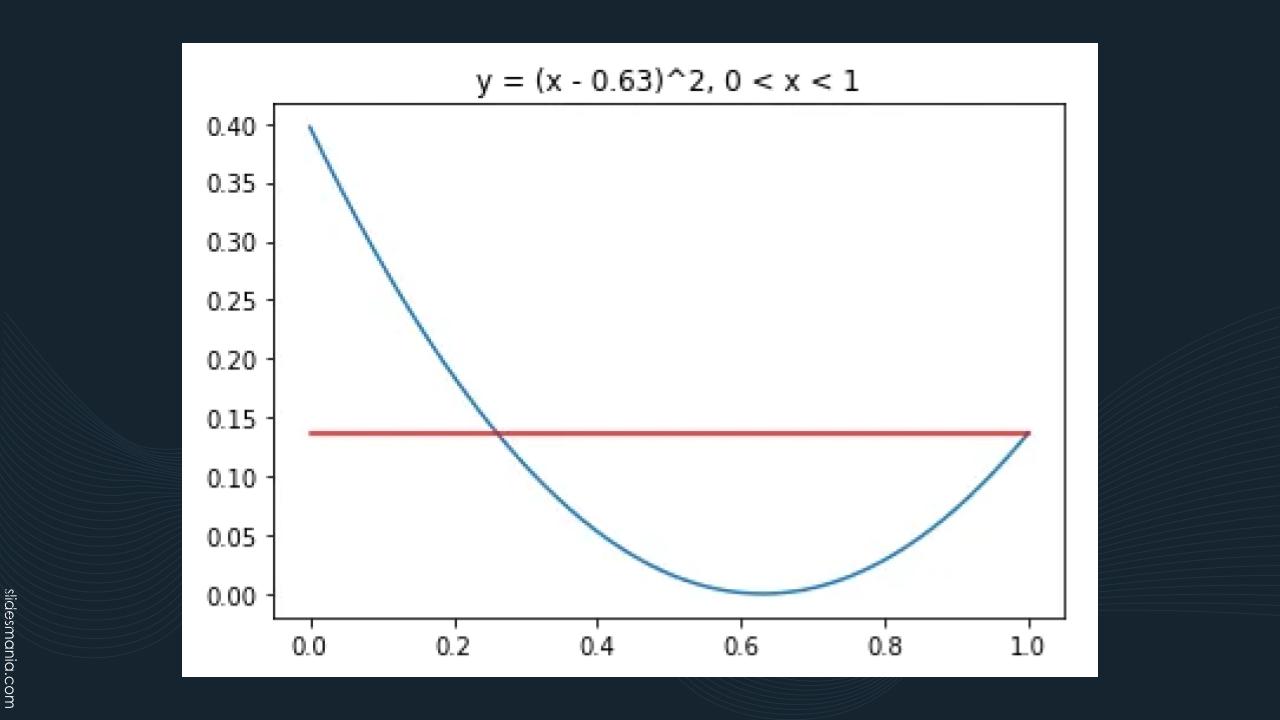
Sadly, no. Instead, B contains a calculated value — it’s the result of the equation y = (x – 0.63)^2 (In many programming languages, “^” is the exponent operator. For example 3^2 means “3 raised to the power of 2,” which is 9.)
y is the resulting value that goes into the B column. x is the actual proportion of Black people in the area, as you can see that x has to be between 0 and 1 (that’s what the “0 < x < 1” part means).
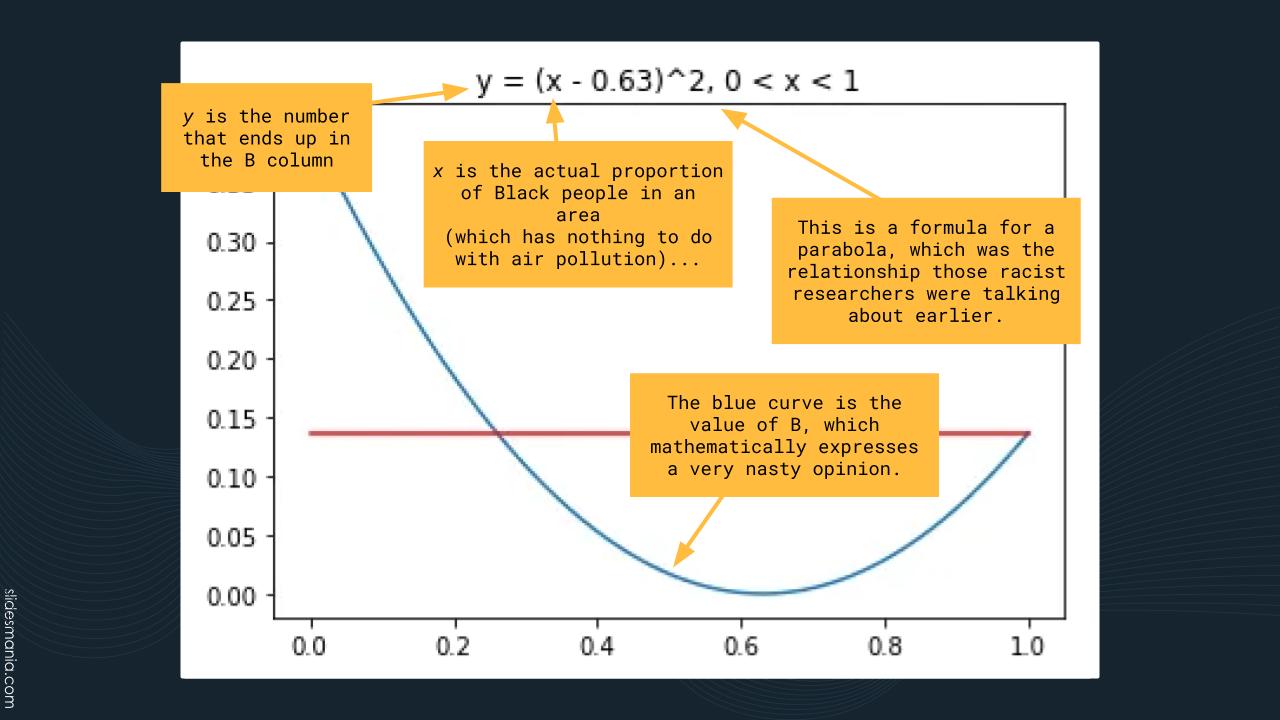
Equations of the form y = x^2 describe upward-opening parabolas. With a basic y = x^2 parabola, the lowest point of the parabola happens when x is 0. With the formula for the parabola above — y = (x – 0.63)^2 — the parabola gets shifted to the right, so that the lowest point is when x = 0.63. In this case, the function says that house prices:
- Are highest when a neighborhood is all-White
- Lowest when a neighborhood is 63% Black
- Climb as a neighborhood becomes more than 63% Black, but only up to a point that’s less than half the house prices in an all-white neighborhood. The graph hits this limit because x has to be between 0 and 1 (you can’t have fewer Black people than 0, or more Black people than 100%).
Another problem with this equation is that it loses original data. For almost every value of y (except the parabola’s lowest point), there are two possible values for x: the one on the left side of the parabola, and another one on the right side.

Once again, I remind you: this was for a research paper about AIR QUALITY affecting HOUSE PRICES.
There are other issues with this data, and they’re covered in the essay racist data destruction?.
This was also the 1970s. We’re talking barely a decade after the Civil Rights Act of 1964, the deaths of both Martin Luther King and Malcolm X, and the 1967 court case of Loving v. Virginia, whose ruling finally made interracial marriage legal in all 50 states. We still have a way to go, but wow, was it downright atrocious then.
But we’ve stopped doing unethical science since the bad old days, right? RIGHT?
Ummm…no.
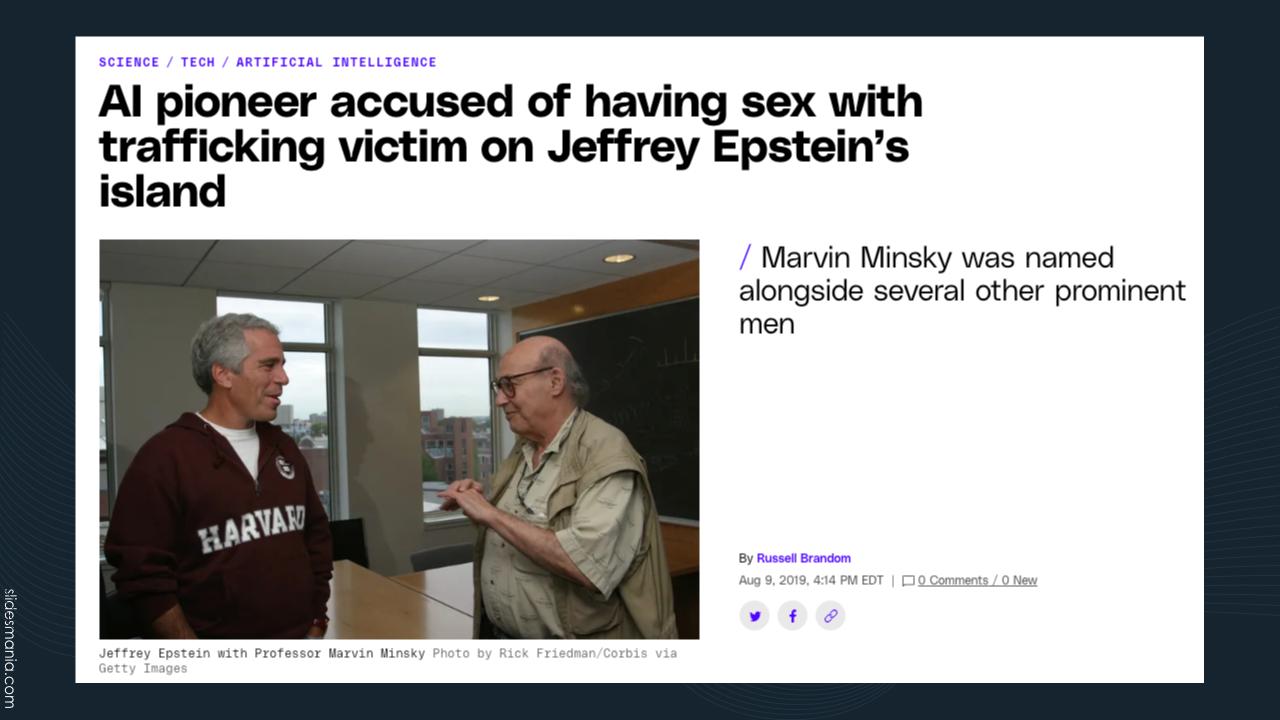
Alas, one of the big names in AI, Marvin Minsky — a cognitive scientist and computer scientist at MIT whose artificial intelligence work is foundational — held a couple of conferences on Jeffrey Epstein’s private island. And yes, this was AFTER Epstein was registered as a sex offender after pleading guilty in 2008 to soliciting a minor for prostitution. By that point, if you were going to the island, you at least knew what “recreational activities” he offered.
Virginia Giuffre, whom Epstein had trafficked for Prince Andrew, testified that Epstein’s associate Ghislaine Maxwell that Maxwell “directed” her to have sex with various people, including Minsky. At the time of the alleged incident, Giuffre was 17 and Minsky was…73.
[ Editorial note: I gave this presentation on September 7, 2023, when Giuffre was still alive. She died by suicide a year and a half later, on April 25, 2025. ]
The screenshot above is of an article in The Verge, AI pioneer accused of having sex with trafficking victim on Jeffrey Epstein’s island.
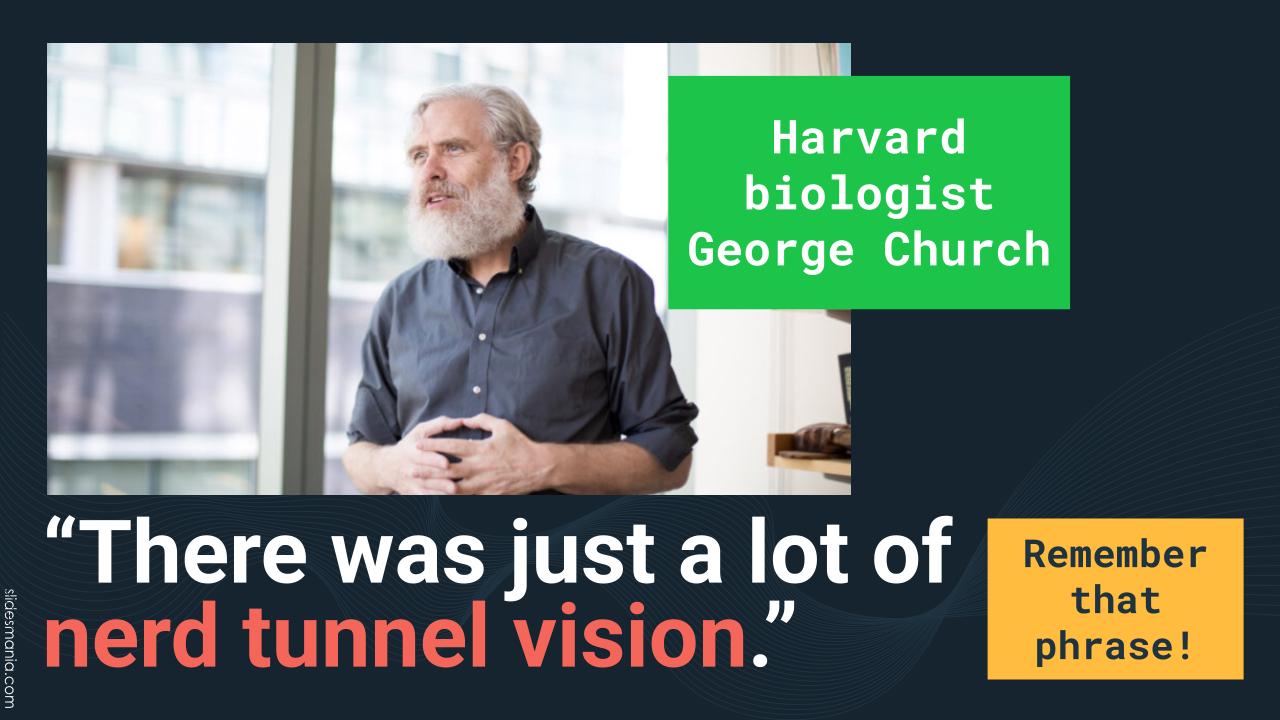
George Church, notable biologist at Harvard — what is it with these Harvard and MIT nerds? — took meetings and calls with Epstein, even after the prostitution-with-a-minor deal became public knowledge.
Unlike Minsky, he fully and publicly apologized: “There should have been more conversations about, should we be doing this, should we be helping this guy? There was just a lot of nerd tunnel vision.”
Remember that phrase, “nerd tunnel vision,” and learn not to get trapped in it. There is more to our area of study than just the study itself, but how what we do affect others.

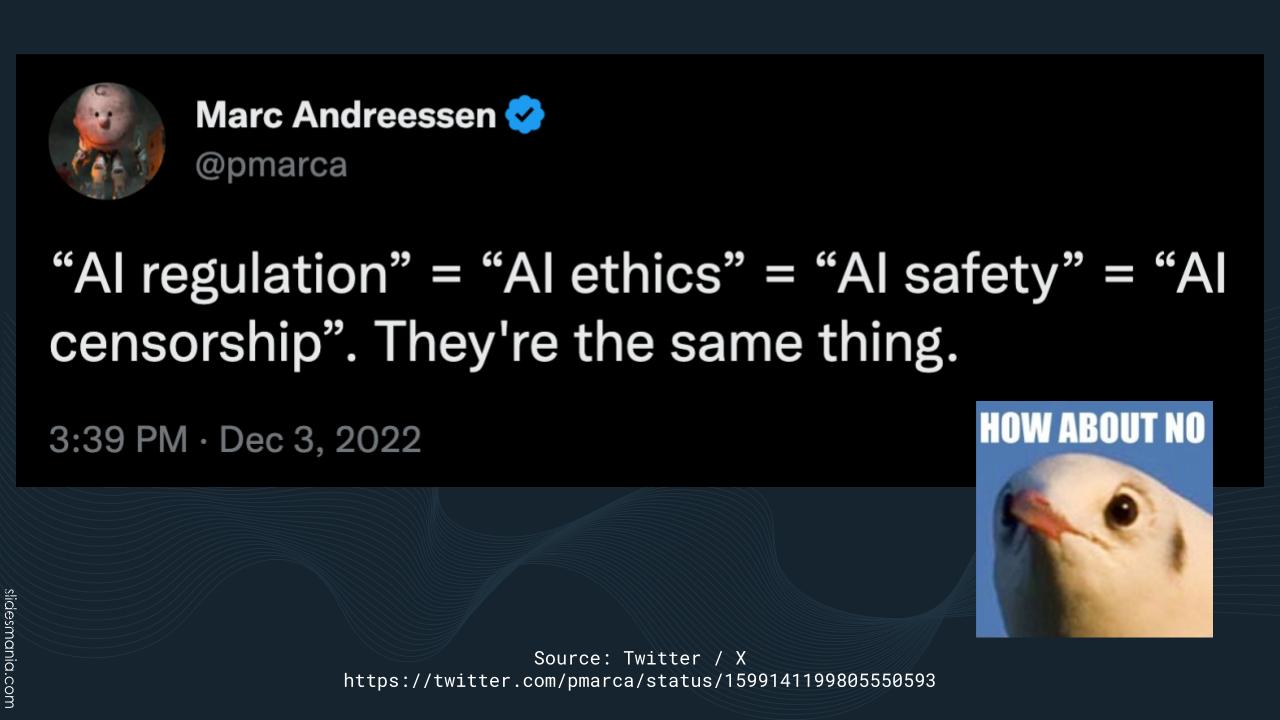
Speaking of nerd tunnel vision…
Ugh, this guy. First famous for helping create Mosaic, the OG graphical browser, then forming the VC firm Andreesen Horowitz, and now super-big AI proponent, but against anything that might slow down its development, even things like ethics.
Here’s the source for this odious tweet.
That damned Silicon Valley mindset. I swear, there should be some kind of system that requires you to get punched in the groin every time you open a copy of anything written by Ayn Rand.
As tech and AI get increasingly intertwined with everyday life, we need to keep this in mind.

Check this stuff out, especially Timnit Gebru’s writing. She was the AI scientist fired by Google for refusing to retract a paper that asks whether enough thought has been put into the potential risks associated with developing large language model-based AIs and strategies to mitigate these risks. That paper is On the Dangers of Stochastic Parrots.
Gebru and one of the co-authors, Emily Bender, discuss the paper in a layperson-friendly way on Adam Conover’s podcast, Factually.
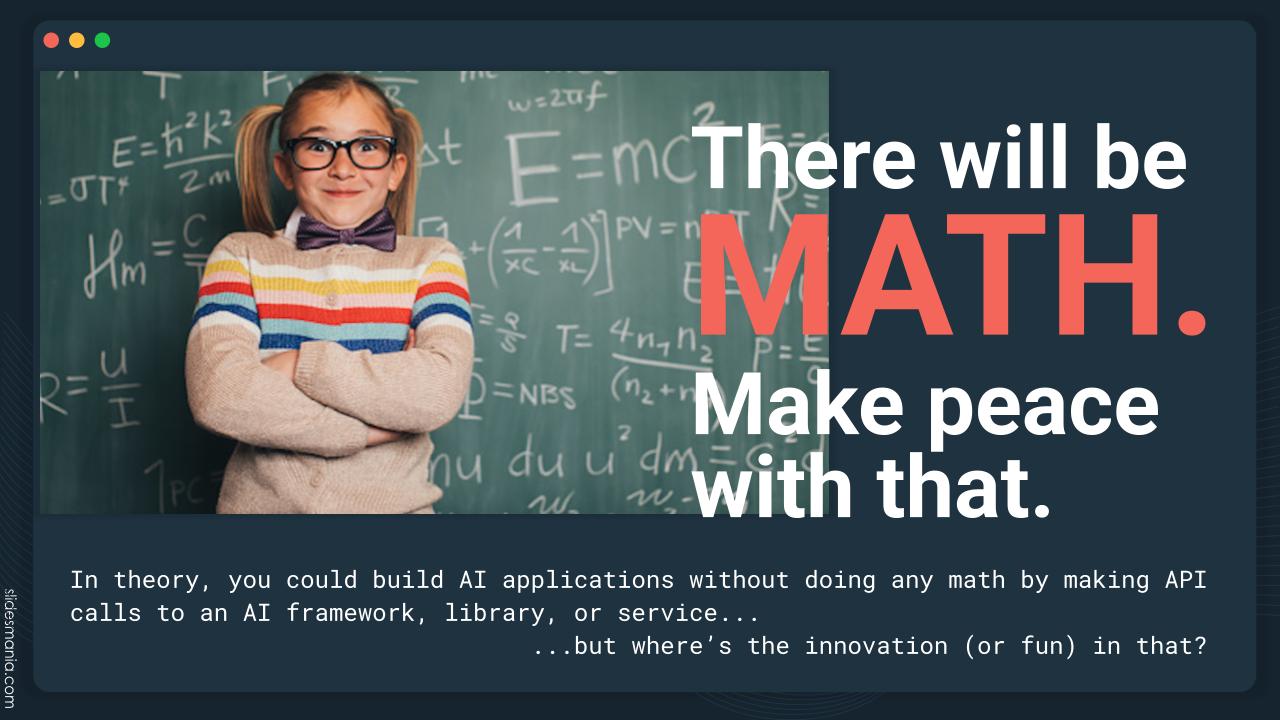
Yes, you can write all sorts of apps that make calls to some AI that provides an API, and there are a lot of use cases where that’s more than enough.
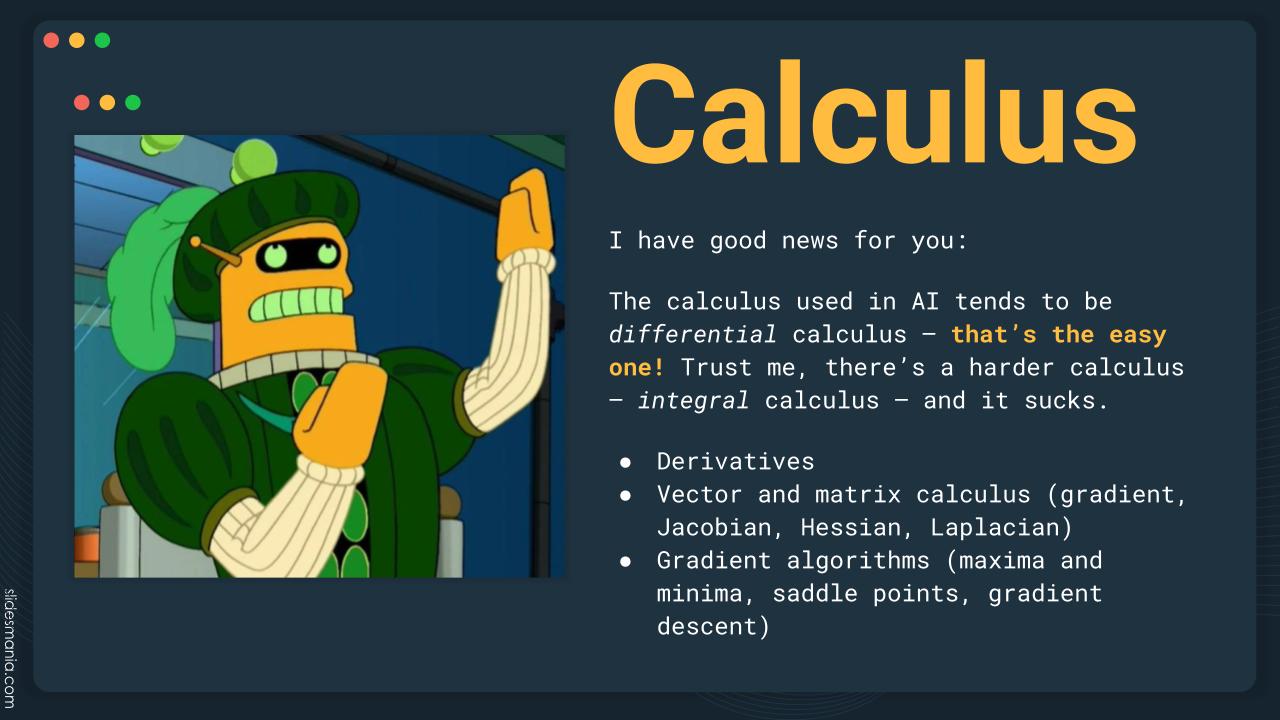
But what if you want to build AIs yourself? If that’s the case, you’ll need to brush up on some math. There are a number of AI libraries that do a lot of the math for you, but you should at least learn the underlying principles. It’s like using a calculator or spreadsheet even though you know arithmetic.
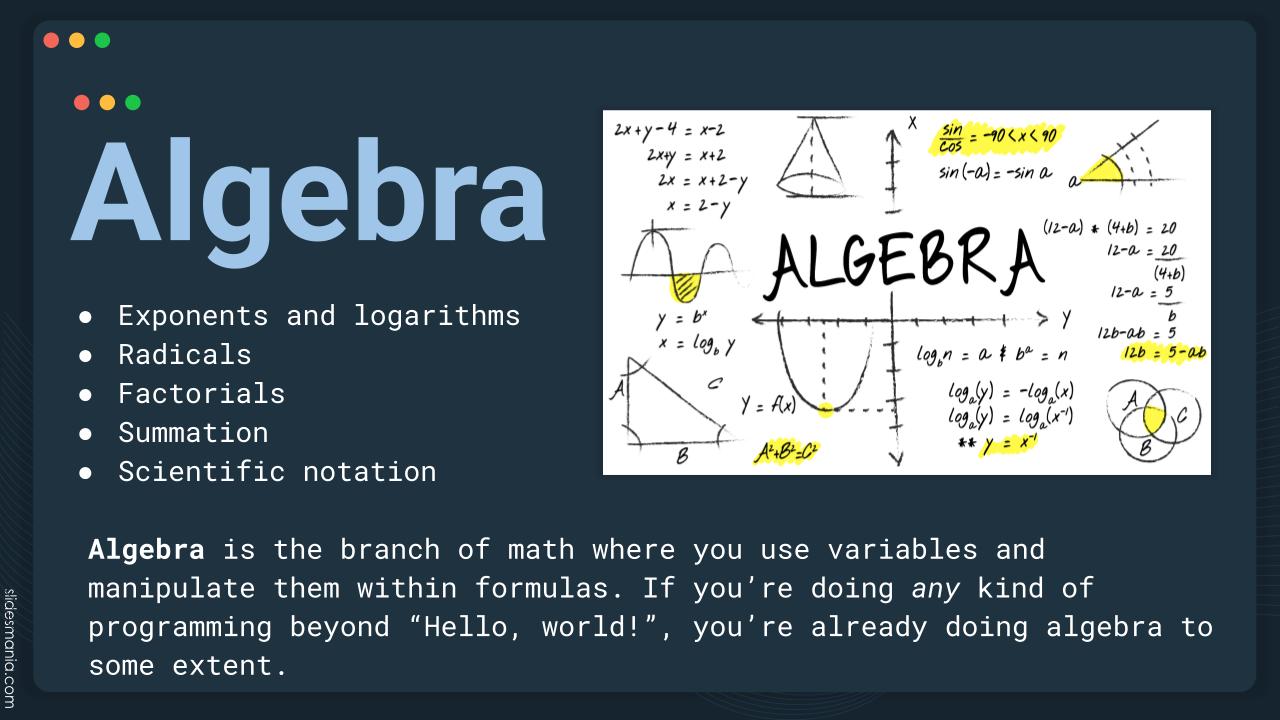
The text on this slide captures the general idea.
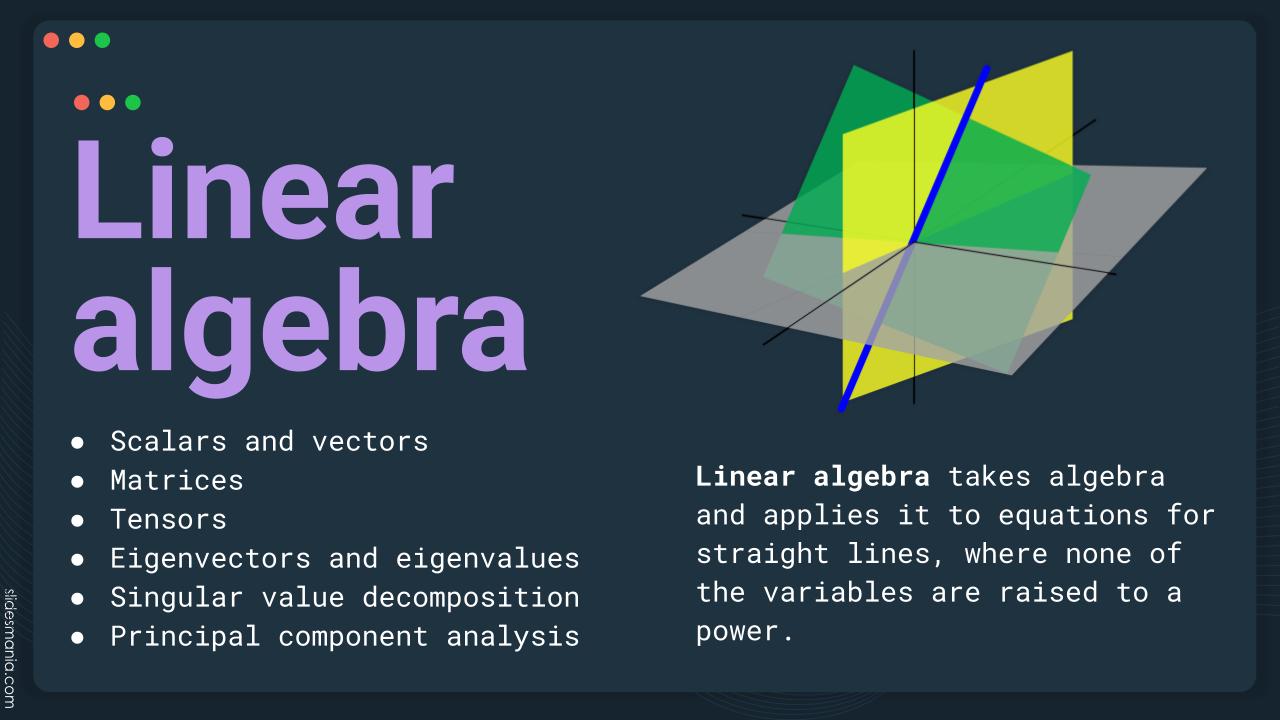
If you’ve written code to draw things onscreen, you’ve probably worked with x-, y-, and possible z-coordinates, and that’s part of linear algebra, which is the algebra of lines and planes.
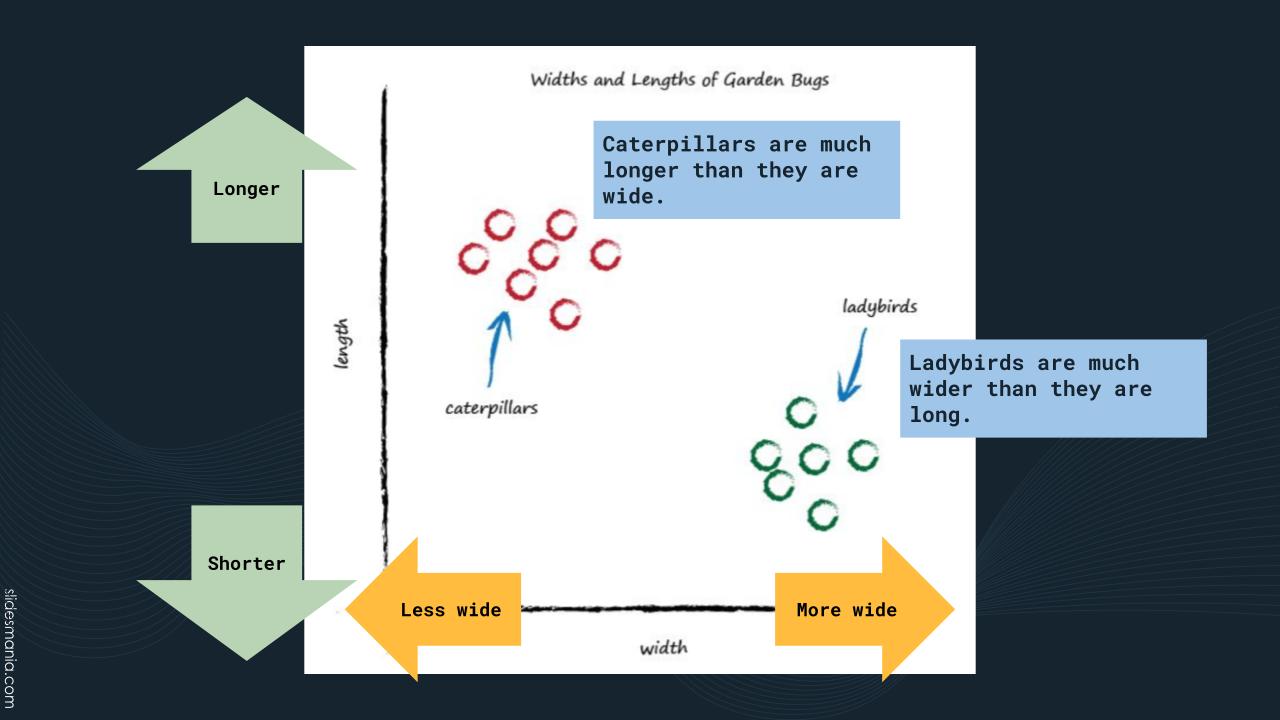
Here’s a simple example of linear algebra being used to perform classification, which is just a fancy way of saying “telling things apart.”
Suppose you’re working with two different kinds of garden creatures: caterpillars and ladybirds. Caterpillars are long creatures, and not very wide. On the other hand, ladybirds are wide creatures, but not very long.
If you took the length and width measurements of caterpillars and ladybirds and plotted them on 2-D graph, with the x-axis representing the creature’s width and he y-axis representing the creature’s length, you’d get a graph like the one above. In this graph, the caterpillar measurements are clustered around the upper left, representing values where the creature is long, but not wide. The ladybirds are clustered around the lower right, representing values where the creature is wide, but not long.
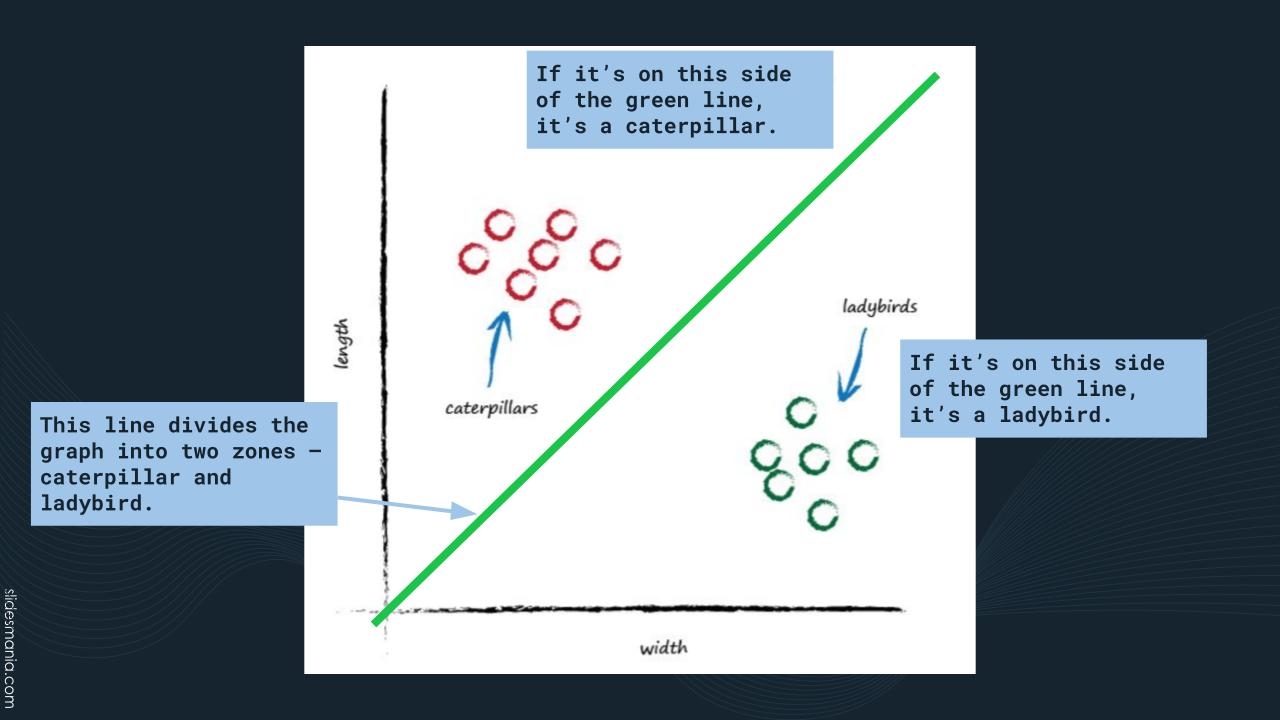
We can use linear algebra to find the equation of a line that divides the measurements into two different zones: one for caterpillars, and one for ladybirds. If a creature falls on the “caterpillar” side of the line, we classify it as a caterpillar. If it falls on the “ladybird” side, we classify it as a ladybird.
The text on this slide captures the general idea.

Speed is the rate of change of distance. You can see it in the way we express speed — in terms of distance over time (for example, 55 miles per hour).

The text on this slide captures the general idea.
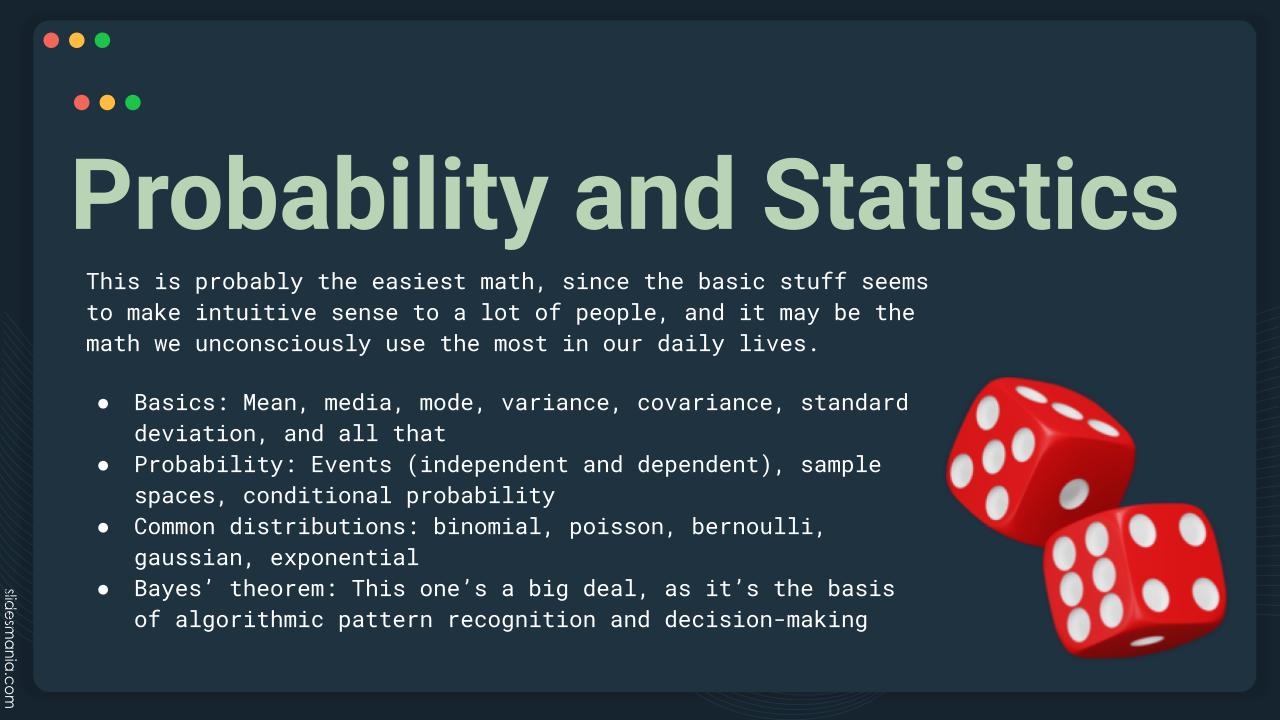
The text on this slide captures the general idea.

It’s not every day I can Rickroll an entire room!

The text on this slide captures the general idea.

These books are friendly introductions to the kind of math you’ll want to know if you want to developer AI applications:

The text on this slide captures the general idea.

If you need an entertaining introduction to AI, what it can do, and more importantly, what it does terribly, hilariously, wrong, you’ll want to check out You Look Like a Thing and I Love You. The book gets its title from an AI-generated pickup line.
It’s written by Janelle Shane, author of the blog AI Weirdness, which is also a worthwhile read!
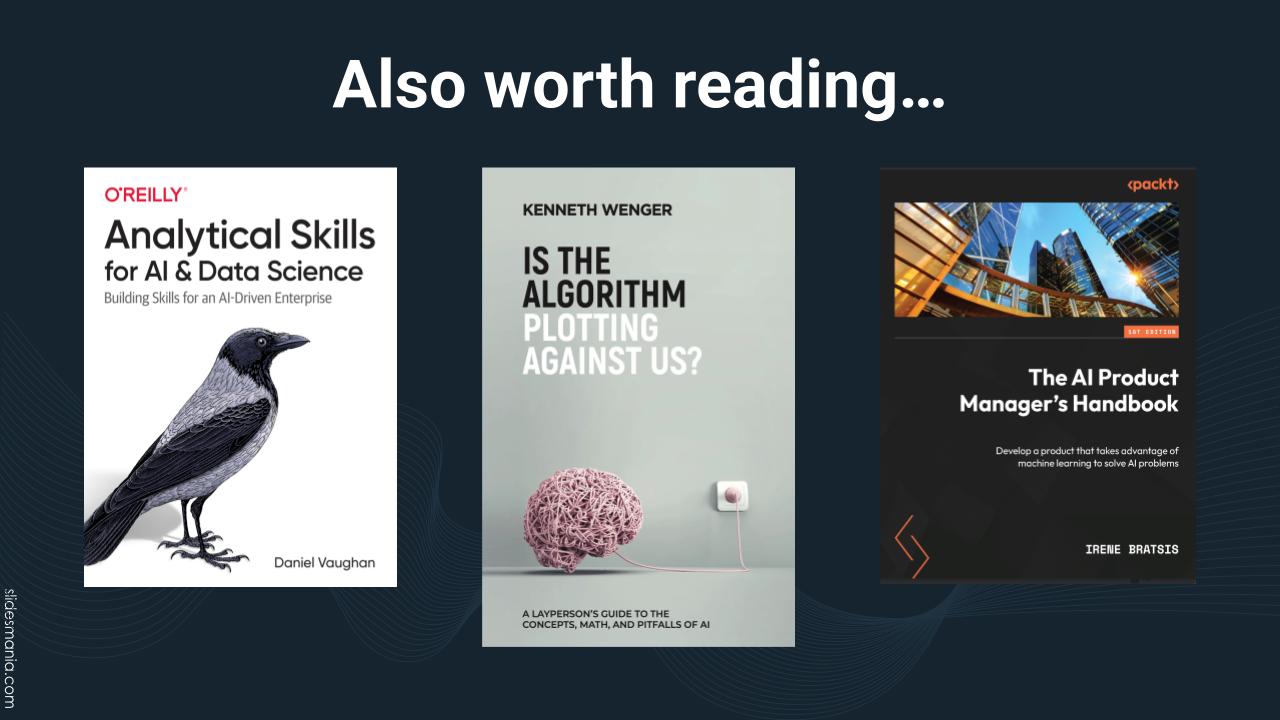
You might also want to check out these books:
- Analytical Skills for AI & Data Science
- Is the Algorithm Plotting Against Us?
- The AI Product Manager’s Handbook
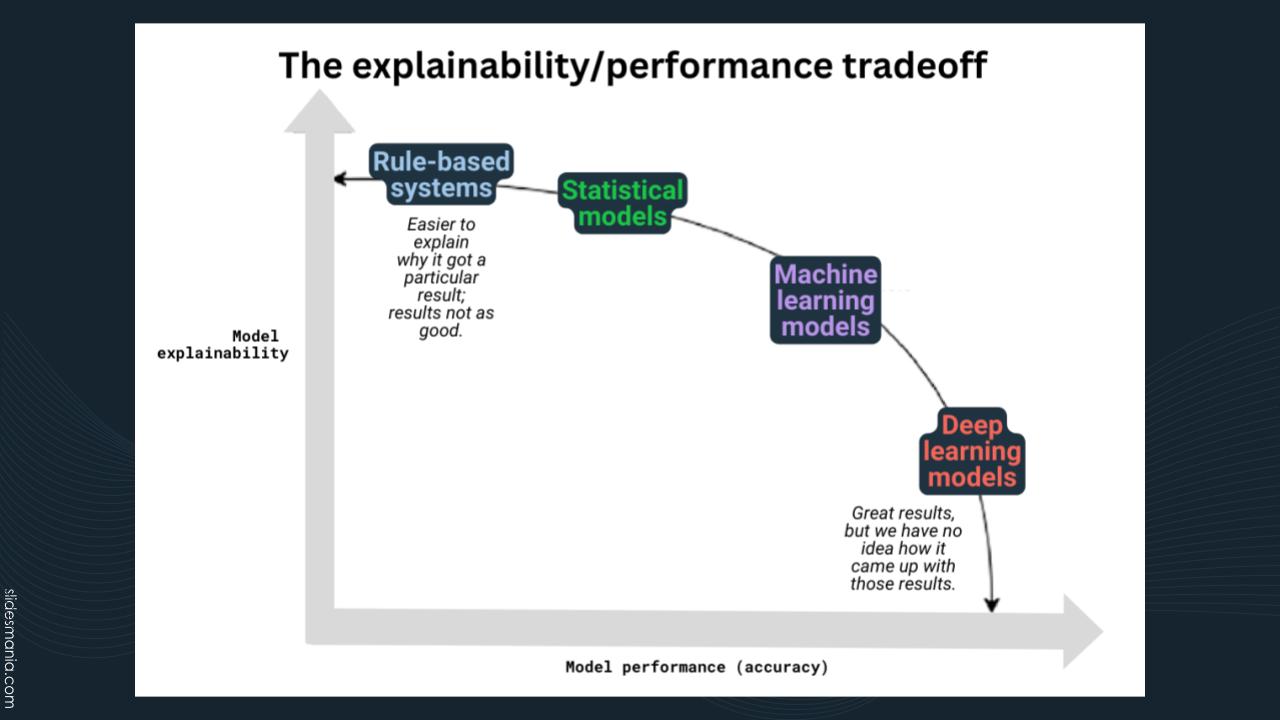
One of the big challenges of AI is explainability, which is the ability to show how an AI came to a decision in a way we can understand and trust. The challenge is that simple AI systems are explainable, but aren’t terribly impressive. The more complex an AI becomes, the less explainable it is.
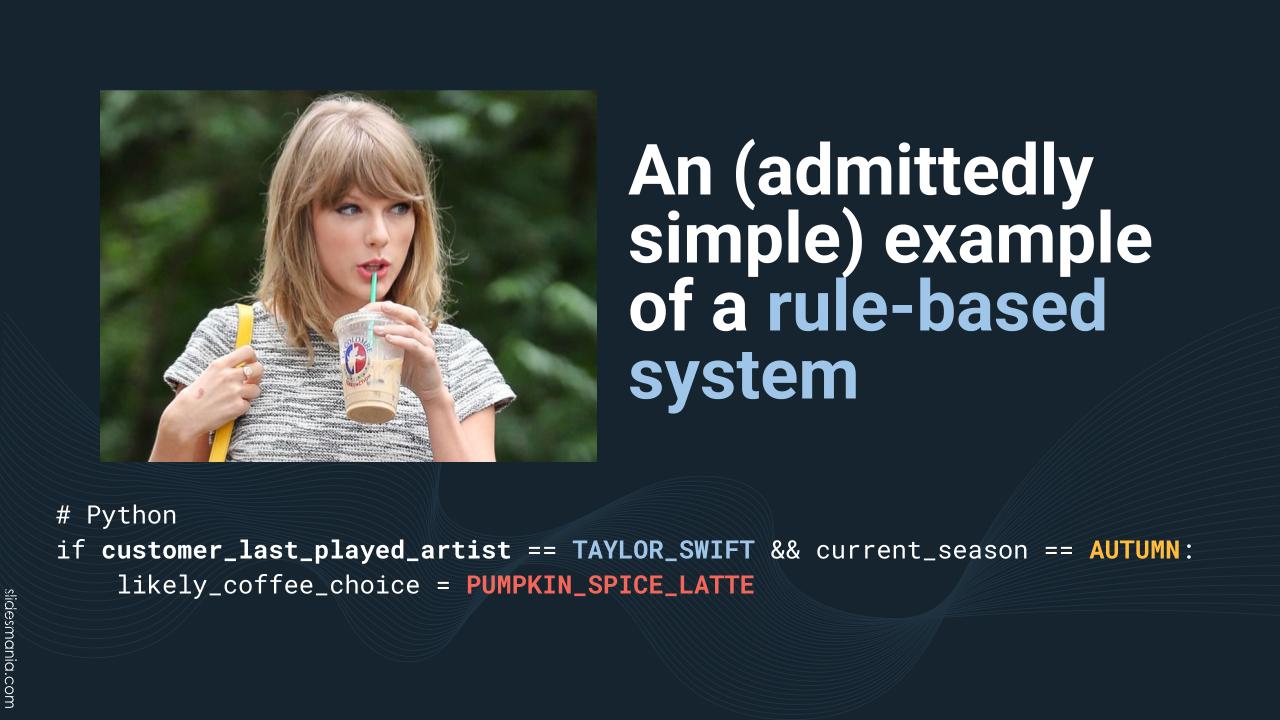
The first AIs were rules-based systems and were essentially giant collections of “IF (this happens) THEN (respond this way)”-style commands.If you could write rules for every possible situation, this style of AI would work well, The problem is, you can’t. But these systems are quite explainable.
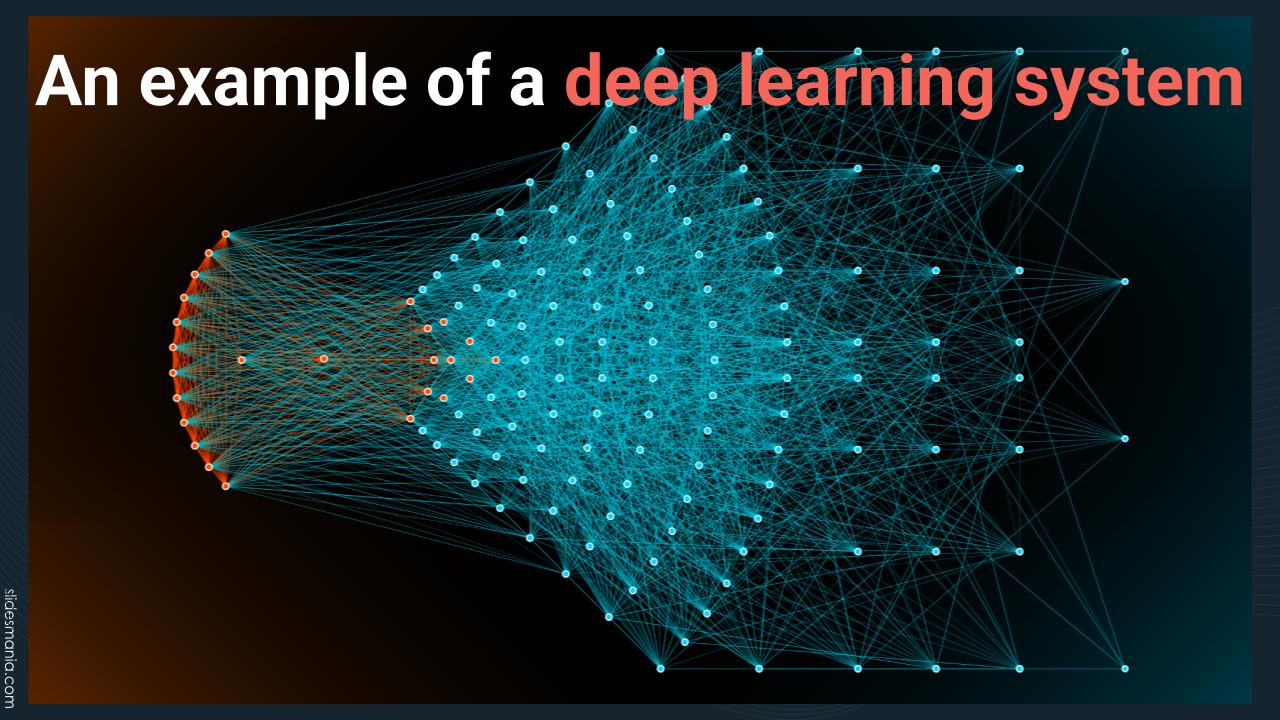
Of course, deep learning systems aren’t rules-based — or at least we’re not providing the rules. Instead, they’re based on artificial neural networks (we often shorten the term to plain old “neural networks”), which are based on the biological neural networks found in animals, including humans. They’re networks of nerve cells, a.k.a. neurons, the building blocks of the brain and nervous system. Individually, they don’t do much, but when arranged into network, they can perform complex calculations.
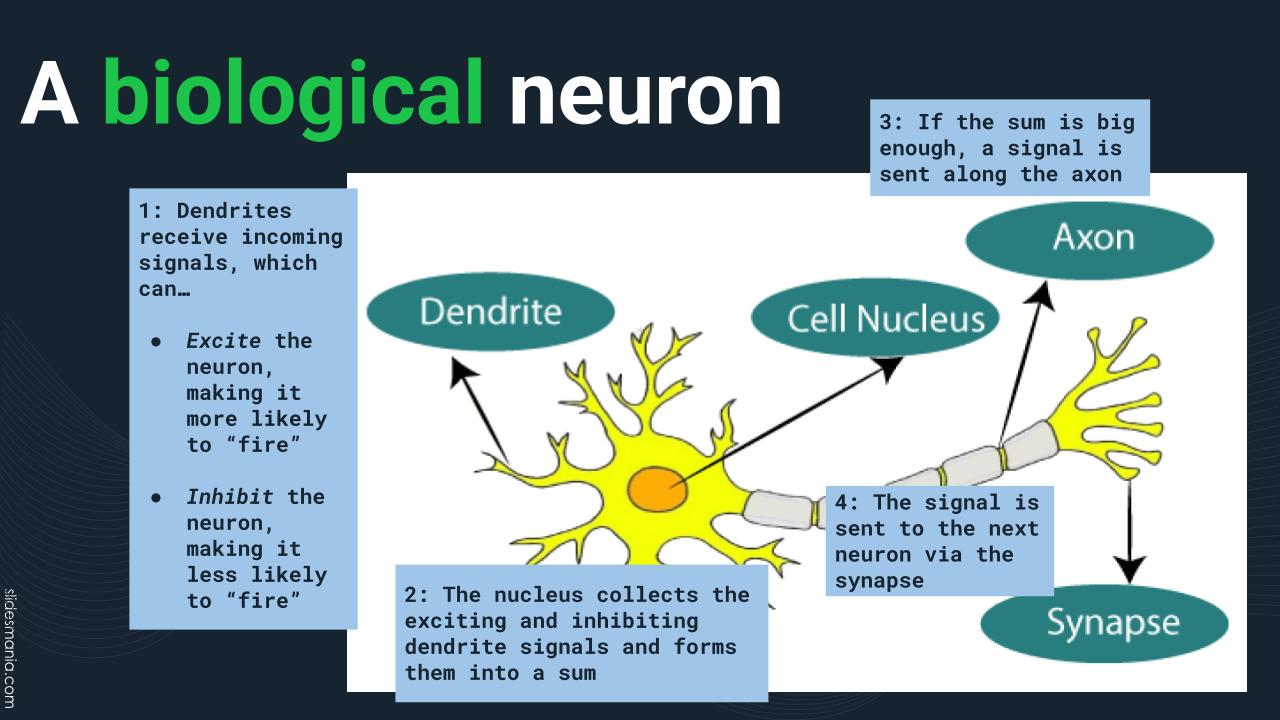
Here’s a closer-up look look at a biological neuron…
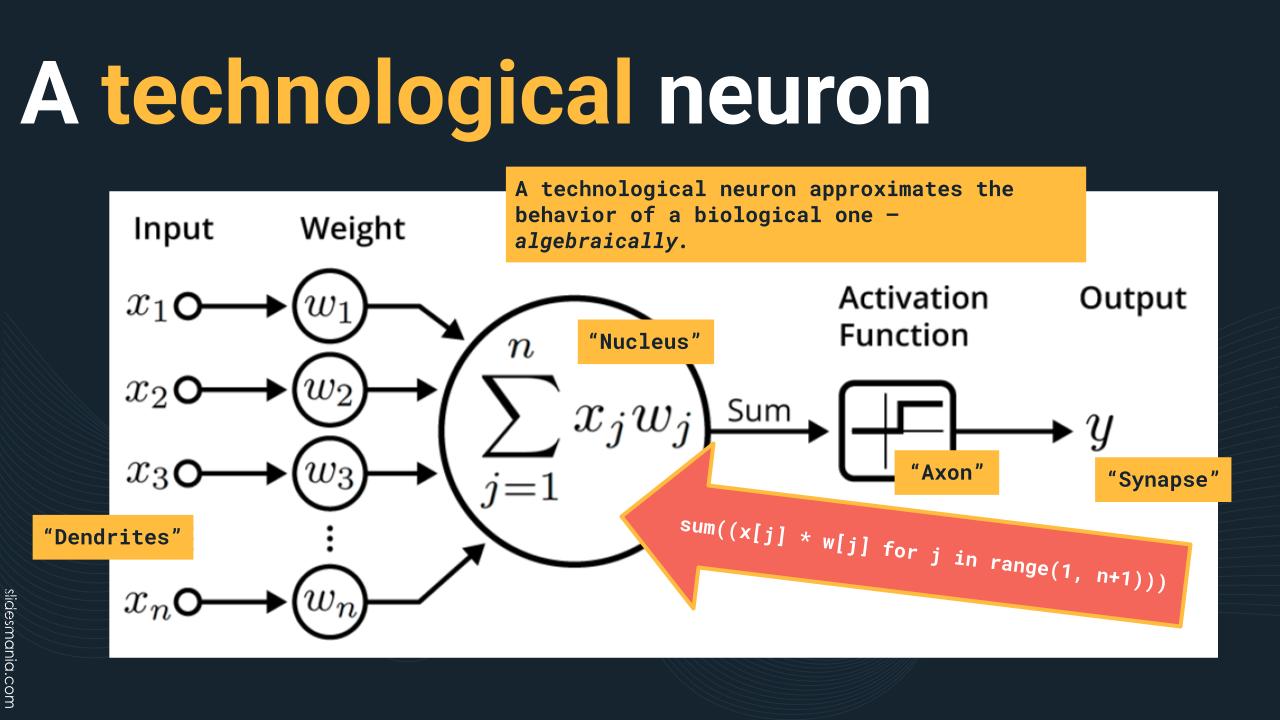
…and here’s a technological neuron. The dendrites are inputs that take in numbers, each of which is then multiplied by a weight value. These results are totalled into a sum, which is then run through an activation function, which activates only if that sum crosses a specific threshold. If the sum does cross that threshold, the neuron produces an output value, which is the equivalent of a biological synapse firing.

It’s things like these that make me think “I’m not sure I like being in this episode of Black Mirror.”
However, these two books do cover some interesting topics and seem worth checking out. Maybe buy them under a different identity!
- Man-Made Women — The Sexual Politics of Sex Dolls and Sex Robots: The topic is an ethical minefield, and this book takes it head-on.
- The Palgrave of Malicious Use of AI and Psychological Security
And yes, I’ll talk a little bit about programming. Not too much, because my time’s nearly up, and because there are more than enough OTHER AI presentations on writing code.
The text on this slide captures the general idea.
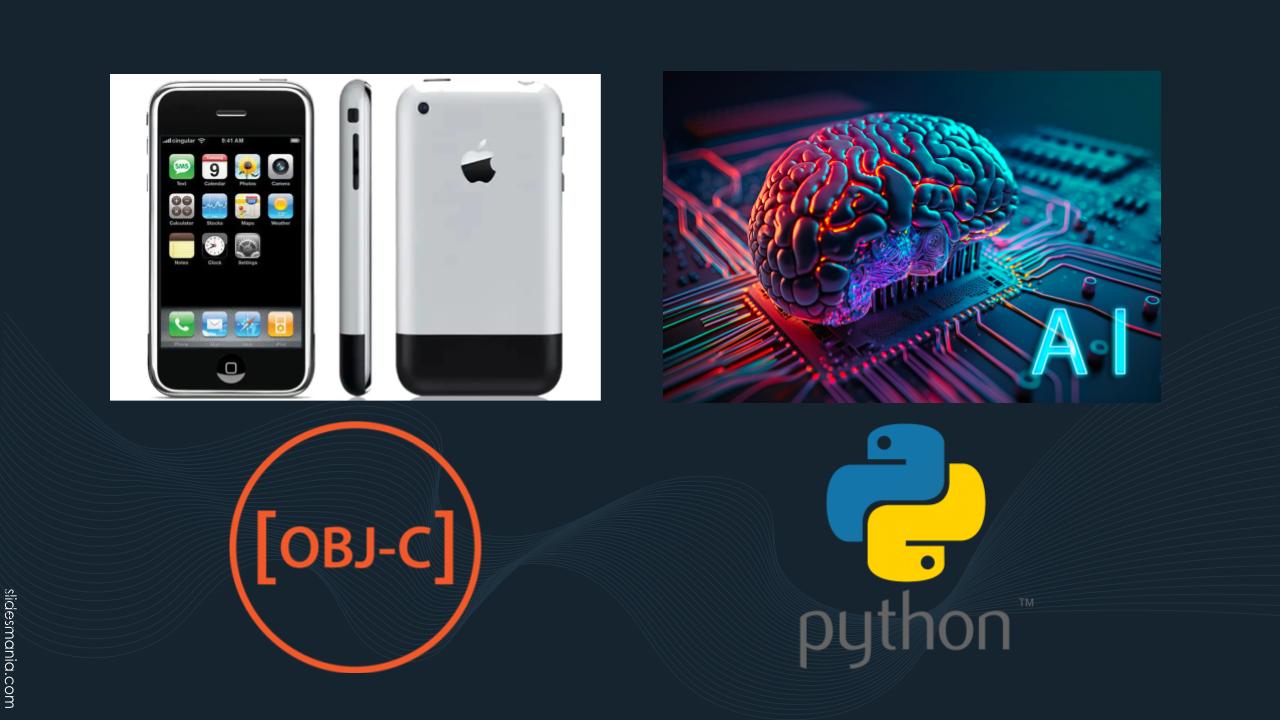
Objective-C, while a pretty good programming language (and in my opinion, preferable to C++), languished in obscurity through the 1980s and 1990s. The only platform that really used it was NeXTSTEP, the operating system for NeXT Computer, which Steve Jobs founded after getting kicked out of Apple.
Objective-C might have stayed obscure if not for Apple purchasing NeXT in 1996 and Steve Jobs taking over Apple after CEO Gil Amelio was ousted in 1997. This led to the old Apple “System” OS being replaced with OS X, which was NeXTSTEP with an Apple coat of paint on top of it. OS X was the basis for iOS, and iOS drove adoption of Objective-C to never-before-seen levels.
It was the TIOBE Programming Language Index’s language of the year for 2011 and 2012 and peaked in popularity in 2014 — the year Swift (the current programming language for Apple systems) was introduced. Even today, there are still vestiges of NeXTSTEP in macOS, iOS, and other Apple operating systems — you’ll still see classes whose names begin with the letters “NS,” which is short of NeXTSTEP.
Python was introduced in 1991 but was constantly overshadowed by other programming languages — first by Perl in the late 1990s, when web developers adopted it heavily before switching to PHP. Then, in the late 2000s, it was eclipsed by Ruby, thanks to Ruby’s killer app, Ruby on Rails.
However, the web revolution brought about by Perl, PHP, and Python drove the data science revolution of the 2010s — and Python was thriving in data science, thanks to its easy-to-learn syntax and extensive math and scientific computing libraries. That same data science revolution also meant that for the first time, it was easy to access lots of data to train neural networks, and AI grew in leaps and bounds. Today, Python is the top language on the TIOBE Index, and was TIOBE’s programming language of the year in 2021.
I have a “programming language time-investment strategy” that goes like this:
- I devote 70% of my time to the programming languages that pay the bills. In my current role as a developer advocate at Okta specializing in mobile development, these languages are Swift and Kotlin.
- I devote 20% of my time to the programming languages that look like likely next things. For a while, that was, and continues to be Python, although now I’m more focused on Python for AI.
- I devote 10% of my time to the programming languages that just look like fun, and who knows, it may pay off! Once upon a time, Python was in this slot. These days, those languages are…

Julia — it’s supposed to have:
- C’s speed
- Python’s flexibility
- Ruby’s dynamism
- R’s statistics capability
- Matlab’s linear algebra capability
Mojo — a very new language created by the same person who created Swift (the Apple programming language), which has these benefits:
- It’s a superset of Python — that is, valid Python code is also valid Mojo code. You can stick to writing only Python code in Mojo, but then you’d be missing out!
- Because it’s a superset of Python, it can use Python’s libraries.
- Mojo is superfast. It’s designed to take advantage of the hardware it’s running on, including GPUs. It also has built-in parallelization, autotuning, types and type-checking, and all sorts of optimizations to make it faster.
Both are great for AI. I’m paying a little more attention to Mojo at the moment, but at the speed at which things are moving these days, you have to be ready to pivot!
At last, the conclusion!
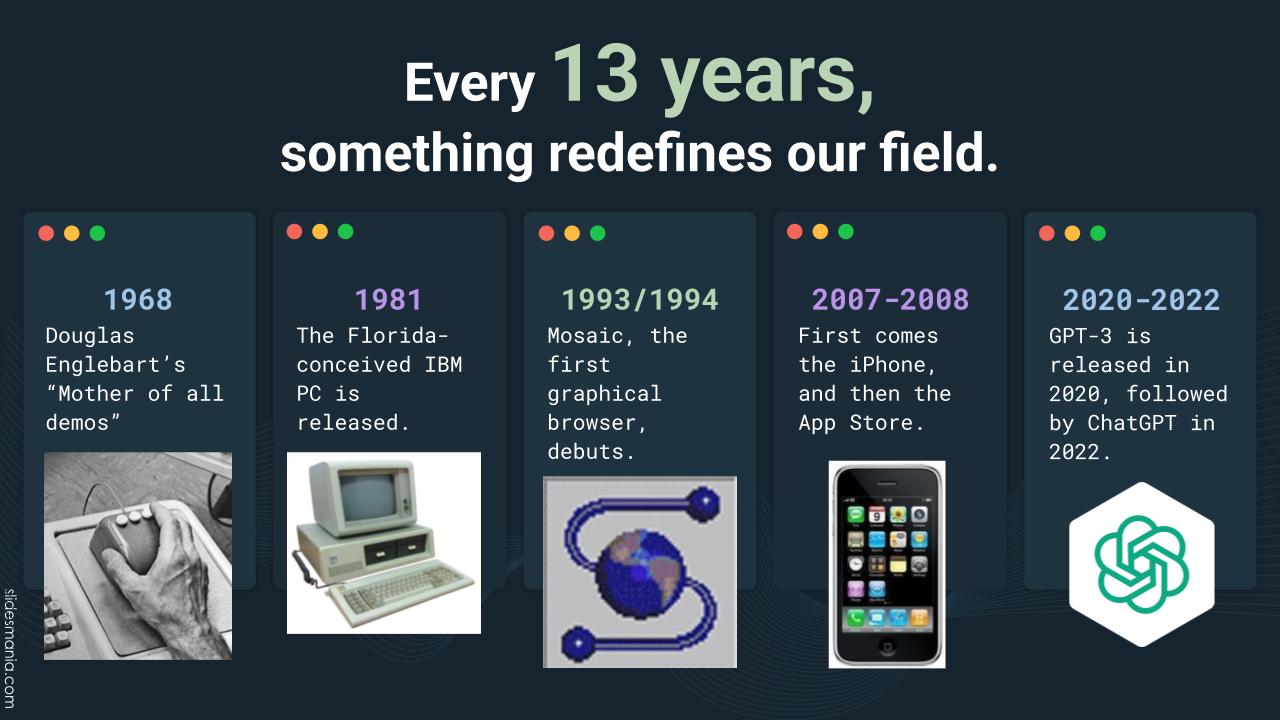
When ChatGPT was released in late November 2022, I showed it to friends and family, telling them that its underlying “engine” had been around for a couple of years. The GPT-3 model was released in 2020, but it went unnoticed by the world at large until OpenAI gave it a nice, user-friendly web interface.
That’s what got me thinking about my thesis that 2020 might be the start of a new era of initially-unnoticed innovation. I started looking backwards to the previous industry-changing leap: the iPhone in 2007, which created the age of the smartphone, which gave us ubiquitous computing and the mobile internet.
13 years before 2007 is 1994, the year the Netscape Navigator browser was introduced, and created the age of the web.
13 years before 1994 is 1981, the debut of the IBM PC, the machine that put desktop computers in more offices and homes than any other.
13 years before 1981 is 1968, when The Mother of All Demos took place — Douglas Englebart’s demonstration of what you could do with computers, if they got powerful enough. He demonstrated the GUI, mouse, chording keyboard, word processing, hypertext, collaborative document editing, and revision control — and he did it Zoom-style, using a remote video setup!
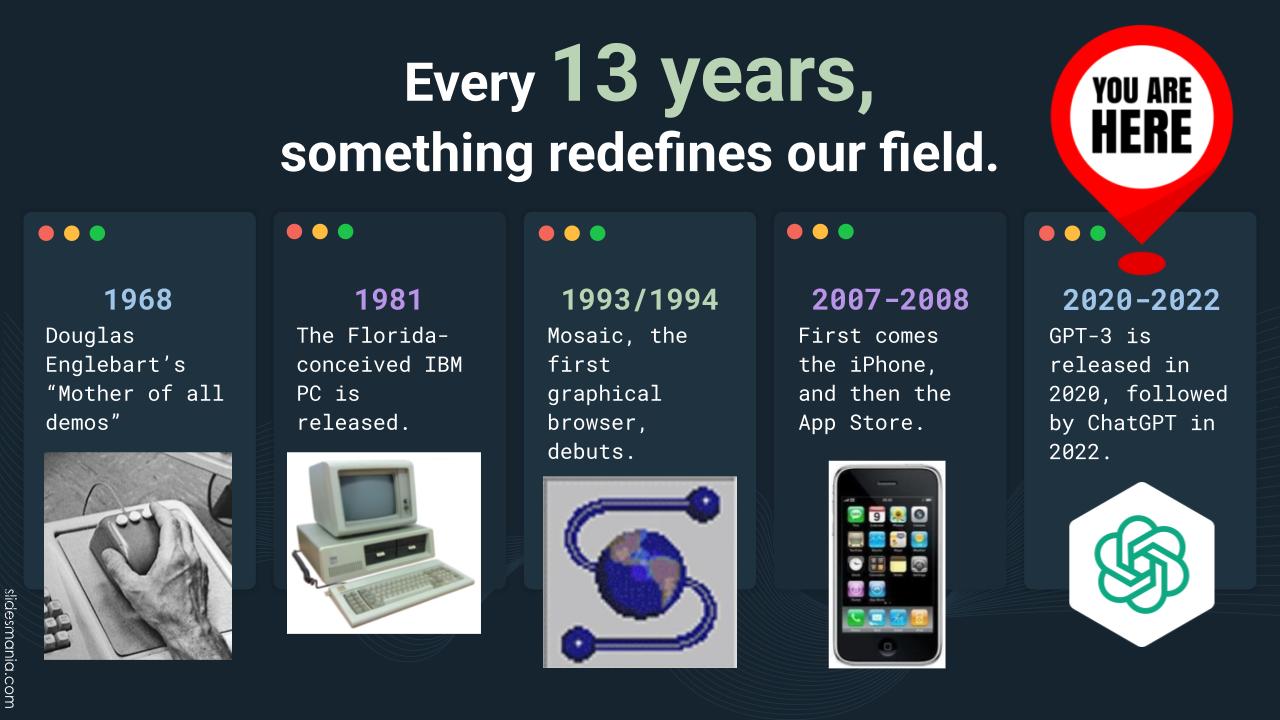
It’s 1968, 1981, 1993, and 2007 all over again!
How do you capitalize on this opportunity as a centaur?
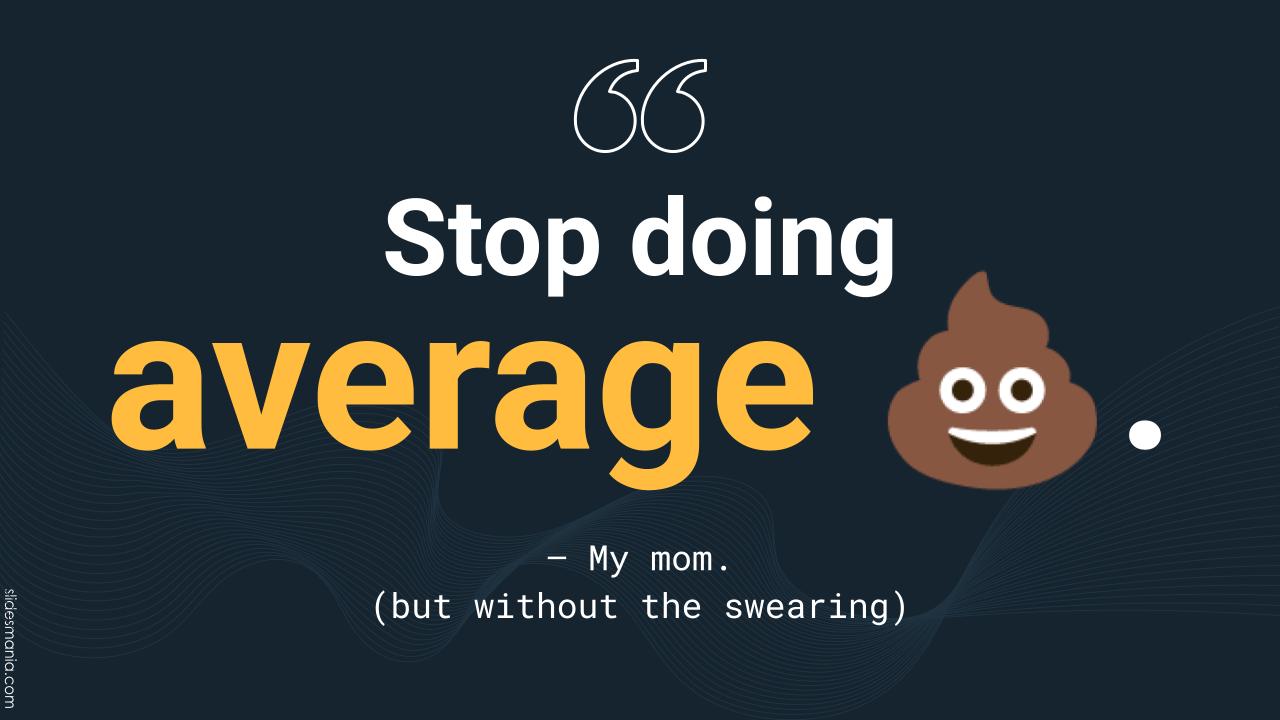
STOP DOING AVERAGE SHIT, like my mom says — but minus the swear word.
Average is staying at home and watching the new live-action “One Piece” on Netflix (which is getting record-breaking viewer numbers, by the way). Your being here to learn about AI and meet with fellow AI aficionados is NOT average. Keep it up — coming to events like this is how you learn, share ideas, and stay inspired!
Be sure to check out these local AI and AI-related meetups:
- Tampa Bay Artificial Intelligence Meetup, which I organize
- Tampa Bay Generative AI Meetup, which James Gress organizes
- Tampa Bay Data Science Group, which is under the Tampa Devs umbrella
- TBDEG — Tampa Bay Data Engineering Group
- Data Analytics – Tampa Bay
- Tampa Bay Python
- Data, Cloud, and AI in Tampa
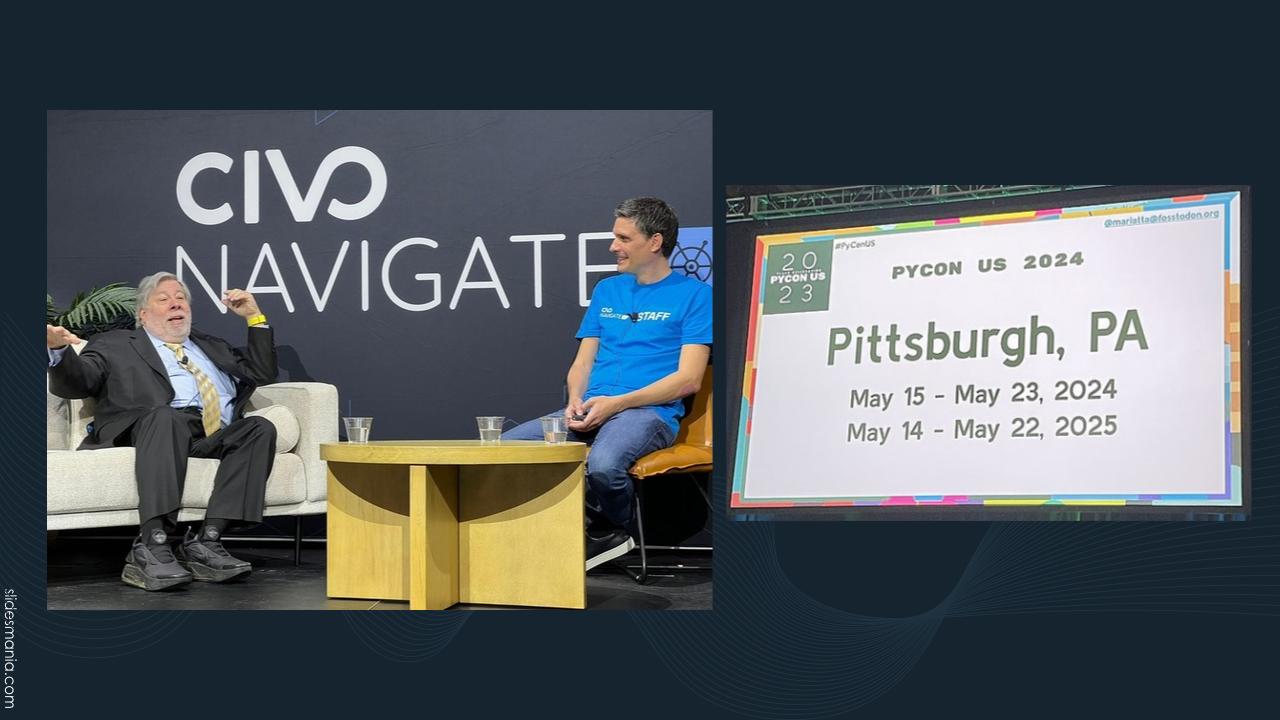
There are some great conferences here and nearby. Even people from outside the US are choosing Tampa Bay for their conferences, like Civo Navigate back in February. If you missed that, you missed a great one.
And for the next 2 years, PyCon US — the world’s biggest Python conference — is happening in Pittsburgh.
And last but not least — the best way to be a centaur is to just build things! Just follow the clean version of Florida’s unofficial state motto: “Fool around and find out!”