Ours is a field where change is just one of those things you have to live with. The constant evolution of computers – from mainframes to the computing devices in our pockets that just happen to also be phones – along with the almost-daily introduction of new technology stacks, requires us to be constantly learning new things. Here are some tips that should help you on your ever-going learning journey in software development…
Choose Your Reading Material
With developer technologies changing so quickly – especially in hot, rapidly-evolving areas such as this blog’s focus, mobile – finding reading material can be tricky. My two pieces of advice:
- Take advantage of websites that focus on the material you’re trying to learn. For instance, in my studies of iOS development, I follow sites like RayWenderlich.com and iOSDeveloperTips.com, which feature regular and frequent updates.
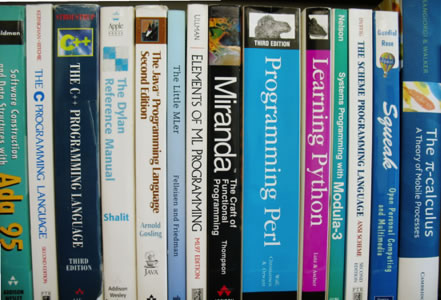
- If you’re going for books, favour ebooks over paper books. Programming is a subject that changes so quickly that all but the most timeless of books on the subject – books like Knuth’s Art of Computer Programming – go out of date in a matter of months. I just recycled a copy of Core Java 2, which dates from 2003.
Pick a Project

Remember this mantra: “I hear, I forget; I see, I remember; I do, I understand”.
Reading is helpful, but to truly learn a programming language, library, or technology, there’s no substitute for getting your hands dirty and actually working on a project that uses that programming language, library, or technology. “Finish project X with this list of features and functionality” is a more concrete, more measurable goal than “Learn programming language X”, “Learn library Y”, or “Learn technology Z”; it also gives you a better idea of your progress, gives you valuable experience, and even gives you something to add to your portfolio. If you can, learn by building a full project rather than just following code examples from your reading.
Most people understand the need the practical experience that comes from learning by building a project. The hard part, they say, is coming up with an idea for that project. Some suggestions:
- Do you have a friend or someone in your family who could use an application that makes use of the language, library, or technology that you’d like to learn? I’ve got a couple of young nephews, and I’ve found writing games for them has been a great way to learn frameworks like XNA and Cocos2D; I’m hoping to write a Sprite Kit-based game for them soon.
- Is there an open source project that makes use of the language, library, or technology that you’d like to learn? You may find that contributing to it or forking it is a great way to learn. You may also find that working with an existing project is easier than starting from scratch.
- Do you know of a business or charity that could use an application that makes use of the language, library, or technology that you’d like to learn? Here’s a chance for you not only to learn and have a new application in your portfolio, but also to have a user base who can give you a lot of feedback.
Learn by Teaching
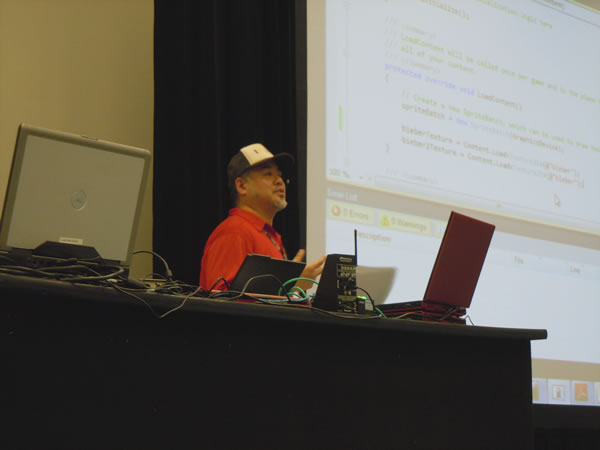
Yours Truly, teaching basic game development for Windows Phone, 2010.
During my time as a developer evangelist at Microsoft, I did tutorial presentations and wrote online tutorials regularly. Sometimes I’d cover material that I knew well, but since Microsoft has such a wide array of tools and technologies and are coming up with new ones all the time, I often found myself having to learn the material that I would end up teaching.
This turned out to be a great way to learn new things. Having to teach the material you’re learning is a good motivator, and the need to make your understanding of the material comprehensible to others help to guide your own learning. As Floor Drees, a tech reporter and developer evangelist in Austria puts it, “I genuinely believe that teaching skyrockets your own learning curve and would encourage everyone to start coaching beginners, even if you feel you are still a beginner.”
If you’re given decent study and teaching material – and luckily, at Microsoft, that’s usually easy to find – and enough time and tools to experiment with mini-projects to get a better understanding, and if you’re comfortable in the role of teacher, whether one-on-one, in front of a crowd, or as an author, you may want to try learning by teaching.
Deal With Speed Bumps

As you brush up on your development skills, you’ll hit the occasional “speed bump”: some kind of problem that you can’t figure out or that leaves you stuck without any idea of how to solve it.
This is a good thing.
Really, it is. If you’re ever learning something new and you find that absolutely everything is coming to you without even the slightest bit of difficulty, it means that you’re not actually doing any real learning. The best and most valuable learning experiences are those in which you struggle with a problem, try all sorts of things, and then finally find the solution. You learn a lot during those times when it feels like you’re fumbling in the dark, trying to piece together a way to make something work, and it tends to stick with you afterwards.
During these times, there are a few things you can try:
- See if there’s a project that you’ve already successfully done that has a solution similar to the one you’re trying to implement.
- See if there’s a project that someone else has done and posted online that has a solution similar to the one you’re trying to implement.
- Make use of online developer forums. Stack Overflow is your friend, and it’s saved me a lot of headaches over the years. Many developer communities also maintain their own forums; be sure to check those out as well.
Take Some Classes

I’m one of those developers who learns through a combination of building my own projects, looking at the code of other people’s projects and learning through teaching. However, that’s not everyone’s style; some people prefer the structure provided by a classroom environment. Luckily, there are a number of options for those of you who prefer this style of learning:
- Many schools and community colleges offer programming courses that are available not only to fully-enrolled students, but the general public.
- If you live in a city with a tech-centric coworking space or a “hackerspace”, you may find that they offer some programming instruction for groups, sometimes for free.
- A number of cities now offer “boot camp” style instruction, in which you can learn a programming language or whole technology stack through intensive classes and hands-on sessions that span days or even weeks.
- If you’ve got a business whose developers need training for enterprise tools and technologies, such as Microsoft’s, Oracle’s, Java, or in areas ranging from SOA and cloud to agile development and business analysis, consider courses from training organizations such as Web Age Solutions.


 In the talk, he tells the story of a four-year-old girl watching a movie on television: