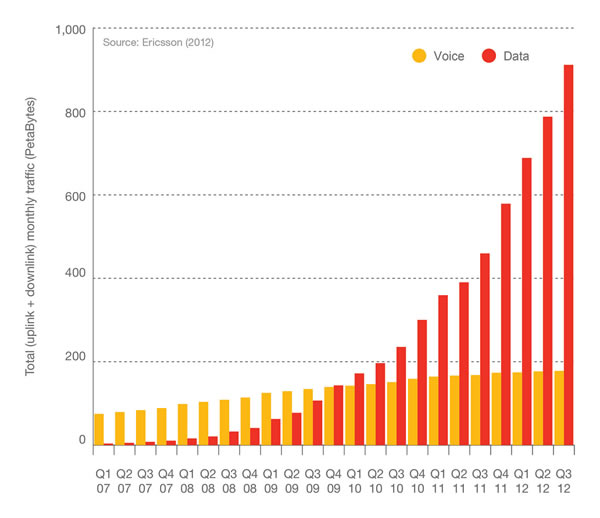
Data in this graph does not include traffic from WiFi, Mobile WiMax or DVB-H.
The graph above comes from Ericsson’s Mobility Report for November 2012 [312MB PDF] and shows the total quarterly mobile voice and data traffic, both up (data sent from the mobile device) and down (data sent to the mobile device), from the start of 2007 to the third quarter of 2012. While mobile voice traffic — represented by the orange bars in the graph above — climbs at a slow, steady and linear rate, mobile data traffic — the red bars — is rocketing at a rate closer to exponential.
The traffic is expressed in petabytes. For those not familiar with that unit of measure, a petabyte is…
- one quadrillion, or 10^12 bytes or
- 1,000 terabytes or
- 1,000,000 gigabytes or
- the total combined storage capacity of almost 16,000 64GB phones or 32,000 32GB phones or 64,000 16GB phones.
As you can see from the graph, we’re not all that far off from having to measure quarterly traffic in exabytes (one quintillion, or 10^15 bytes).
To get a better sense of how just how much data this is, I’ll give you some comparisons, courtesy of the blog High Scalability:
Petabyte (1 000 000 000 000 000 Bytes)
- 1 Petabyte: 5 years of EOS data (at 46 mbps)
- 2 Petabytes: All US academic research libraries
- 20 Petabytes: Production of hard-disk drives in 1995
- 200 Petabytes: All printed material or production of digital magnetic tape in 1995
Exabyte (1 000 000 000 000 000 000 Bytes)
- 5 Exabytes: All words ever spoken by human beings.
- From Wikipedia:
- The world’s technological capacity to store information grew from 2.6 (optimally compressed) exabytes in 1986 to 15.8 in 1993, over 54.5 in 2000, and to 295 (optimally compressed) exabytes in 2007. This is equivalent to less than one 730-MB CD-ROM per person in 1986 (539 MB per person), roughly 4 CD-ROM per person of 1993, 12 CD-ROM per person in the year 2000, and almost 61 CD-ROM per person in 2007. Piling up the imagined 404 billion CD-ROM from 2007 would create a stack from the earth to the moon and a quarter of this distance beyond (with 1.2 mm thickness per CD).
- The world’s technological capacity to receive information through one-way broadcast networks was 432 exabytes of (optimally compressed) information in 1986, 715 (optimally compressed) exabytes in 1993, 1,200 (optimally compressed) exabytes in 2000, and 1,900 in 2007.
- According to the CSIRO, in the next decade, astronomers expect to be processing 10 petabytes of data every hour from the Square Kilometre Array (SKA) telescope.[11] The array is thus expected to generate approximately one exabyte every four days of operation. According to IBM, the new SKA telescope initiative will generate over an exabyte of data every day. IBM is designing hardware to process this information.
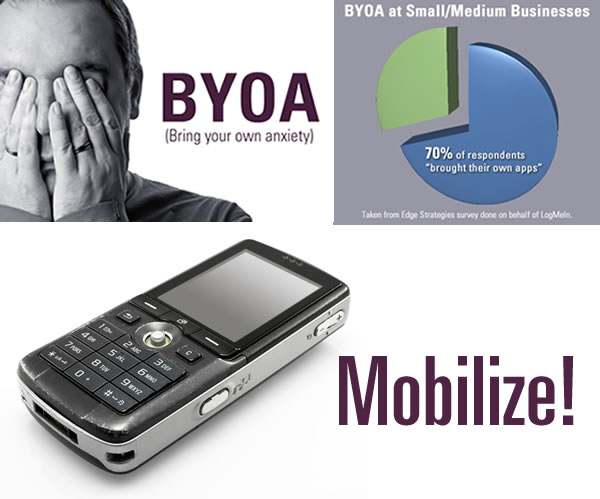
This article also appears in Mobilize!: The CTS Mobile Tech Blog.

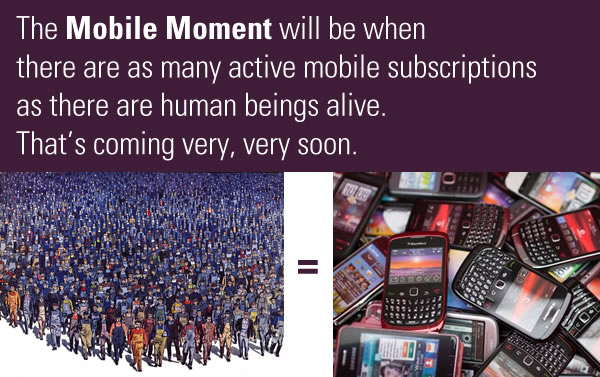
 Tomi Ahonen is one of the mobile industry gurus to whom I regularly pay attention. He’s an ex-Nokia exec now based in Hong Kong, and he’s forgotten more about the mobile industry than most people will learn. His stature in the field is such that