“The street finds its own uses for things,” is a quote from William Gibson’s short story, Burning Chrome, which has become an often-quoted aphorism used to explain that people often find unintended uses for technology.
The term “Shadow IT” sounds like something that Gibson would’ve coined for one of his cyberpunk novels, but the term was most likely invented by IT pros. Shadow IT refers to systems or software used by people in an organization without the knowledge or approval of the IT department. A group of people opting to use a spreadsheet that they email back and forth instead of a company-approved means of storing and sharing crucial data (I know of at least one Fortune 50 company that does this), employees using Evernote and DropBox to share notes and files, an enterprising developer who builds an unsanctioned custom piece of software to simplify or automate an onerous task — all these are examples of shadow IT. As you’ve probably surmised from the term, IT departments take a dim view of these unsanctioned (and often unknown-to-them) tools and technologies.
You’ve probably already guessed some of the implications of shadow IT, some of which are:
- Security risks
- Inconsistencies and incompatibilities with company systems and methods
- Wasted investment in company systems
- Increased risk of data loss and leaks
- Animosity between employees and IT
With all these downsides and articles warning of the dangers of shadow IT, many of which have been explained to employees time and time again in emailed memos, employee manuals, and training sessions, why do they insist on using shadow IT?
This Dilbert cartoon explains it quite nicely:
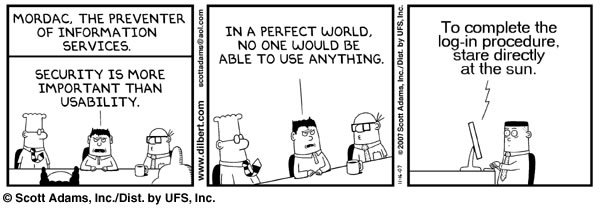
In many companies, the IT department is seen as being like “Mordac, the Preventer of Information Services” from Dilbert. They’re the technology dictators, the people whose job seems to be to get in your way rather than help you get things done. That perception doesn’t just with employees, but with the people providing services that often make up shadow IT, such as 37signals, builders of web-based work tools. Here’s an excerpt from an article in their blog, titled The End of the IT Department, in which they talk about IT departments being replaced by tools like theirs and people’s increasing tech-savviness:
If businesses had as many gripes with an external vendor, that vendor would’ve been dropped long ago. But IT departments have endured as a necessary evil. I think those days are coming to an end.
The problem with IT departments seems to be that they’re set up as a forced internal vendor. From the start, they have a monopoly on the “computer problem” – such monopolies have a tendency to produce the customer service you’d expect from the US Postal Service. The IT department has all the power, they’re not going anywhere (at least not in the short term), and their customers are seen as mindless peons. There’s no feedback loop for improvement.
…
At the same time, IT job security is often dependent on making things hard, slow, and complex. If the Exchange Server didn’t require two people to babysit it at all times, that would mean two friends out of work. Of course using hosted Gmail is a bad idea! It’s the same forces and mechanics that slowly turned unions from a force of progress (proper working conditions for all!) to a force of stagnation (only Jack can move the conference chairs, Joe is the only guy who can fix the microphone).
…
You no longer need a tech person at the office to man “the server room.” Responsibility for keeping the servers running has shifted away from the centralized IT department. Today you can get just about all the services that previously required local expertise from a web site somewhere.
It’s no wonder that according to a recent study by Stratecast and Frost & Sullivan [842KB PDF, 13 pages], 80% of knowledge workers use software or services in their work that have not been officially cleared for use by IT. It’s not that they’re setting out to disobey IT or expose the company to risk; it’s just that they find the sanctioned tools don’t cut it, and that the IT department seems to refuse to respond to their needs. So they went out and found better, more suitable tools on their own initiative.
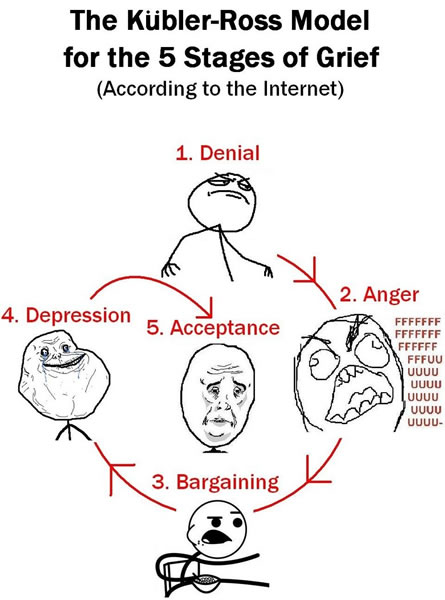
It’s time for IT departments to move through those stages of shadow IT-caused grief as quickly as possible to “acceptance”. As Arthur Cole says in his IT Business Edge article, Shadow IT: A Problem of IT’s Own Making:
As the traditional gatekeeper to data infrastructure, IT has long been viewed as a barrier to progress rather than an ally, and clamping down on shadow IT would simply perpetuate that view and pit IT against business units in a never-ending turf war. Or, IT could adopt a new role in the enterprise that stresses management of both internal and external resources, as well as things like contract negotiations and billing, as a means of providing a value-added service for the new distributed, software-defined data ecosystem.
And already, management platforms are incorporating the tools to do just that. CA, for example, recently launched the new CA Service Management system designed to afford business users the flexibility to compile their own mobile and collaborative environments while preserving centralized control for IT. The system provides a unified approach to accessing services, support and related assets, plus customizable support for mobile platforms like iOS and Android. As well, it promotes automated self-service, collaboration and knowledge-sharing as a means to propel enterprise resource delivery to the level that users have come to expect through their experiences with Amazon, Dropbox and other providers.
It seems, then, that shadow IT is neither friend nor foe, but simply a fact of life in the new data paradigm. If you try to fight it, you’ll probably lose, so for the sake of IT, and the enterprise in general, the best approach is to learn how to leverage it.
Adriana “Andi” Karaboutis, Dell’s Global CIO, encourages her fellow CIOs to Stop Chasing Shadow IT, and Start Chasing Innovation:
When you work in a technology company and have 110,000 best friends that understand technology well and probably even better than you do, you have to be out there working, listening and determining how you can create even more value for the employees and customers that you serve as opposed to being defensive about owning IT … It’s no longer good enough to just be there enabling them; it’s working together side-by-side to co-create value and power and enable the company together.
And finally, this CIO slideshow, Shadow IT: Onetime Hidden, Often Hated, But Well Worth Embracing, puts forth these five cases for embracing shadow IT:
- Bandwidth: IT departments can only take on so much work, and third-party services can help lighten their load.
- Requirements: Shadow IT simplifies the requirements-gathering phase because the people making the tech happen are the people who have to use it, and know the problems, processes, and needs.
- Culture: Shadow IT provides a way for employees who have mastered the tools of the trade to gain some recognition for having done so.
- Lubrication: It cuts down on the friction that so many smaller, lower-priority but still necessary projects and bottlenecks face because the payoff isn’t as visible or as big a deal as big, attention-getting “IT projects”.
- Innovation: Shadow IT is sought out by people who believe that “good enough isn’t good enough”. You should be encouraging these mavericks, not stifling them!
The use of shadow IT at your company suggests that there are needs that aren’t being met, and that people are actively helping themselves and looking for solutions. You should view this as an opportunity to help them, and perhaps even to recast IT as an enabler rather than a barrier.

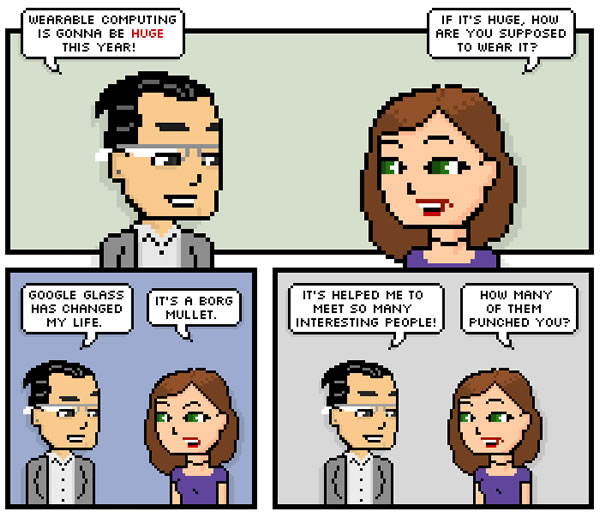
 Cecilia Abadie made history last year as the first driver to be given a traffic ticket for driving while using Google Glass, based on the California traffic law that states that you can’t drive while watching a monitor. She was initially pulled over for speeding on Interstate 15, but when the officer saw that she was wearing Google Glass, she was issued a second ticket for “driving while glassing”.